


Videos
The following are video presentations produced by or featuring Department of Transportation employees.

10 Year Transportation Improvement Plan Webinar
2019 Fall Governor's Advisory Commission on Intermodal Transportation (GACIT) Public Hearing.
10 Year Transportation Improvement Plan Webinar
10 Year Transportation Improvement Plan Webinar
Transcript of video:
00:00 Slide 1
Hello, I’m Pete Stamnas Director of Project Development at New Hampshire DOT. Thank you for
taking the time to watch this presentation on the New Hampshire Department of
Transportation’s Ten Year Plan.
Welcome to the 2019 Fall Governor’s Advisory Commission on Intermodal Transportation
(GACIT) Public Hearing. The GACIT Committee is made up of the five Executive Councilors and
the Department of Transportation Commissioner.
The purpose of the hearing is to discuss the update to the State’s Ten Year Transportation
Improvement Plan. The plan covers the years 2021-2030. There are 20 hearings being held in
the five Councilor Districts around the State. The Hearing is an opportunity for all of the
Executive Councilors, and the NH Department of Transportation, to obtain public comment on
transportation issues, priorities and needs in each region. It also provides an opportunity for
feedback on the projects in the draft 2021-2030 Ten Year Plan, and whether available and
projected revenue amounts meet the needs of the State.
The Ten Year Plan process in NH originated in the late 1980’s and is required as part of RSA
228:99 and RSA 240.
The process allows for Regional Planning Commissions to work with communities to develop
local and regional needs and priorities, and then allows the Department to make
recommendations to GACIT, the Governor and the Legislature. Ultimately, the NH Legislature
determines what the final priorities are relative to transportation projects in New Hampshire.
Each cycle of the Ten Year Plan takes about two years to complete, and as one cycle ends, a new
cycle begins.
For this 2021-2030 Ten Year Plan cycle, the process began in the Fall of 2018 with the Planning
Commissions working with their staff, cities and towns to identify transportation priorities
within their regions. The Department utilized the Commissions’ input and its own ideas and
prepared a draft of the Ten Year Plan. In addition, informational GACIT meetings were held on
June 19, July 31 and August 14, 2019.
Following the Public Hearings this month and next, the Department will make a revised draft
Ten Year Plan for GACIT to consider at meetings to be held in November in Concord.
Subsequently the Ten Year Plan will be forwarded to the Governor by December 1, who will in
turn, forward it to the Legislature by January 15 of 2020. The Legislature will hold additional
hearings and enact the Ten Year Plan into Law by June of 2020. Then the process begins again.
There has already been much discussion and coverage in the press regarding the financial status
of the Ten Year Plan. It is important for us to hear your comments and thoughts on this.
Written comments regarding this draft Ten Year Plan may be submitted through November 12,
2019 to the Department of Transportation. The address is NHDOT, PO Box 483, Concord, New
Hampshire, 03302, and Attention Bill Watson. his address is also noted on the bottom of your
agenda.
Please participate in our online survey. The web link can be found on the DOT Internet
Homepage.
03:09 Slide 2
Over the last few months the DOT has been meeting with GACIT to review funding scenarios and
investment needs along with current and future asset conditions in an effort to identify strategies to
develop the current version of the draft Ten Year Plan. There are a number of needs and there is not
enough funding to meet them all so we have to prioritize how and when we should be investing in
transportation assets.
Many of the strategic recommendations are consistent with those used in previous Ten Year Plan
updates. They include:
Continued focus on the preservation of existing roads;
Continued investment in bridge preservation and structurally deficient bridges to lower the number
of bridges on the red list;
Continue to dedicate SB367 funds to TIFIA loan pledged rural roads and bridges;
Completion of I-93 Salem to Manchester and increase funding for Exit 4A I-93 Derry-Londonderry;
Financially constrain federal programs to $183 million per year.
Include $50 million for new Regional Planning Commission projects in 2029/2030 ($25 million per
year).
04:21 Slide 3
Address major project cost increases on Exit 4A, Bow-Concord, Interstate 4R projects by utilizing
GARVEE bonding on two major bridge projects Hinsdale-Brattleboro and Seabrook-Hampton;
Delaying the Bow-Concord project by two years to 2026;
Transferring 25 percent ($2.2 million) of Congestion Mitigation and Air Quality funds to other
Federal categories;
Maintain and extend all programs by two years;
Invest additional SB367 revenue in paving to improve the projected condition of roads;
Increase investment in bridge preservation and resurfacing programs to mitigate impacts of
inflation.
05:07 Slide 4
The next few slides will provide a high-level funding synopsis for the draft Ten Year Plan.
The federal program that funds highway improvements, The FAST Act, ends in 2020. The annual
funding for the highway mode assumed for financial constraint purposes in this draft was set at
$183 million dollars per year.
Paving and bridge projects average approximately $107 million dollars per year.
Mandated federal programs like Congestion Mitigation and Air Quality and Highway Safety
Improvement Programs average approximately $31 million dollars per year.
GARVEE debt service through 2025 is approximately $24 million dollars per year through 2025 and
the balance of the federal funding for the highway mode is allotted to individual projects averages
$21 million dollars per year.
06:00 Slide 5
State funding for the highway mode includes:
Betterment funds of approximately $24 million per year which is used for preservation and
maintenance of roads and bridges not supported with federal funding;
Turnpike funding for capital and renewal and replacement program averages approximately $67 million
dollars per year;
Senate Bill 367 funds for I-93 Expansion (Salem – Manchester), the State Aid Bridge Program and
TIFIA debt service is approximately $32 million per year net of the Block Grant Aid to Municipalities.
The funding is allotted as follows:
$6.8 million per year to the State Aid bridge program which funds improvements to municipally
owned bridges;
$2 million per year interest only payment through 2025 for TIFIA debt service on the $200 million
dollars loan that funded the completion of the I-93 Salem to Manchester project;
This debt service payment increases to $23.4 million per year in 2025 to include both principal and
interest.
Approximately $23 million dollars per year for TIFIA pledged road and bridge work on rural roads;
approximately $14 million on paving and $9 million annually on bridges. The paving pledge increased by
$2 Million per year due to new road toll revenue projections.
07:24 Slide 6.
The funding synopsis for other modes:
A total of $288 million or $28 million per year on average is programmed for airports through the
Federal Aviation Administration;
A total of $312 million or $31 million per year on average is programmed for transit through the
Federal Transit Administration including funding for the project development phase of the Capitol
Corridor project;
A total of $10.5 million is programmed for maintenance and construction on State owned railroad
lines.
A review of active transportation investments in highway projects in 2019 identified approximately $7
million dollars in spending on active transportation elements like sidewalks, traffic signals, shoulder
widening, sidewalk curb ramps across 28 different projects which equates to approximately 4 percent of
federal apportionment of $183 million dollars per year.
08:21 Slide 7
The notable program funding changes and project additions within the draft Ten Year Plan are as
follows:
$10 million dollars per year is added to the resurfacing program in 2029 and 2030;
$6.5 million dollars per year is added to the bridge preservation program in 2029 and 2030;
$2 million per year in additional SB367 revenue is added to the resurfacing program on average
through 2030;
$1 million per year in additional betterment revenue is added to the resurfacing program through
2030;
Five state owned red list bridges added in the two outer years;
One interstate rehabilitation project added to 2030 at $17million;
CMAQ program is reduced by $2.2 million per year to $8.9 million per year.
09:14 Slide 8
The table in this slide summarizes annual expenditures by category across all funding types. The draft
Plan for 2021 through 2030 includes $3.92 billion in expenditures across 10 categories.
Pavement investment averages $83 million per year, 21 percent of the total program;
Bridge investment averages $88 million per year, 23 percent of the total program;
I-93 Expansion investment totals $70 million over a ten-year period, less than 2 percent of the
program;
Individual project investment totals $810 million over ten-year period, 21 percent of the total
program;
Transit and airport investments total $612 million over ten-year period, 16 percent of the program;
Debt service payments average $26 million per year, 7 percent of the program.
10:07 Slide 9
The table in this slide compares the annual expenditures by category across all funding types for the
current Ten Year Plan covering the years 2019 through 2028 to the draft Ten Year Plan covering the
years 2021 through 2030. This comparison shows the draft Ten Year Plan includes $176 million more
spending than the current plan. Some of the notable increases include:
$50 million increase on pavement;
$119 million increase on bridges. This increase is mainly due to moving bridge investments
previously shown in Individual projects to the bridge category;
$41 million increase to roadside projects. This increase is mainly due to moving Turnpike R&R
roadside investments previously shown in individual projects to the roadside category;
$34 million increase to airports which reflects additional funding.
11:04 Slide 10
The graphic shown at the top of this slide represents a temporal look at the state red list bridge totals
over the last 15 years. A bridge is included on the red list when one of its major elements receives a
poor rating (four on a scale of one to ten) during regular inspections.
The current number of bridges on the red list is 129. All data points to the right of 2019 are projected
totals based on the current funding in the draft Ten Year Plan. Based on the recommended level of
investment in the draft Ten Year Plan of $77 million per year on average, the number of State red list
bridges,
Drops to a low of 124 by 2026;
Increases to 146 by 2030;
HB1817 and SB367 investments in state bridges ($20 million and $77 million respectively) through
2025 is making a difference;
$17 million investment in preservation is reducing the number of bridges coming on the red list;
125 of 129 red list bridges listed in 2019 will be addressed by Ten Year Plan projects or by the
Bureau of Bridge Maintenance.
12:17 Slide 11
Similar to the previous slide on bridges, this slide depicts a temporal look at the condition of state roads
since the early 90’s. The graphic at the top represents miles paved. The graphic at the bottom
represents percent of pavement in good or fair condition. The values in both graphics shown in dark
blue are actual totals. Those to the right of the 2019 line are projections based on the recommended
level of investment included in the draft Ten Year Plan of $74 million per year on average.
Conditions for the next five years are expected to be 80 percent good or fair which is among the
best conditions we have seen over the last 25 years.
Conditions in the later years are expected to decline by 15 percent to 68 percent good or fair. This is
a result of the reduction in miles paved anticipated from 627 miles in 2018 to 335 miles in 2030 and
is heavily influenced by inflation and loss of SB367 funds in 2026.
13:20 Slide 12
Senate Bill 367 raised the gas tax by four cents and generates approximately $36 million dollars annually
for transportation. One of the benefits realized is a $250 million investment pledge in rural roads and
bridges.
From 2014 through 2018, $79 million was invested to resurface 1075 miles of Tier Three and Four roads
in poor or very poor condition which equates to 93 percent of the 1160 miles existing in 2014.
Approximately $90 million in paving pledge remains to be invested which will resurface an additional
1100 miles bringing the total number of miles resurfaced by the end of the program to 2175 through
2030.
The pledge includes work on 25 red listed bridges.
Two are complete, seven are under construction, 15 are under design or will be starting design in the
near future. The map on the right identifies the road segments paved to date along with the bridges
that are included in the pledge.
14:24 Slide 13
The Ten Year Plan is a multi-modal plan and makes investments in all modes.
This table identifies annual expenditures by funding category included in this draft for each of the
various modes. Eighty-five percent of the funding in the $3.92 billion dollar plan is eligible for use on
roads and bridges.
Funding for each mode primarily comes from designated federal and state programs that come with
funding eligibility requirements, which reduces the opportunities to redirect funds to other modes.
Federal Highway funding is the largest source of funding in the plan. Eligible projects include Capital
improvements for pavement, bridges and individual projects (including the I-93 expansion), which leads
to the perception this a highway and bridge plan.
Federal Highway funds are not eligible for Maintenance and Operations work.
15:16 Slide 14
This table compares bottom line totals for the 2019 to 2028 plan with the draft 2021-2030 plan for each
funding category. The draft plan includes $3.92 billion in transportation investments, $176 million
increase over the current plan. Some of the notable changes include:
$95 million increase in Federal Highway funding mainly by utilizing discretionary funding sources;
$16 million increase in betterment from new gas tax revenue estimates;
$43 million increase in TIFIA debt service as there is two additional years of principal payments
(2029 and 2030);
$31 million increase in Turnpike Capital due to two more years of construction included in 2029 and
2030;
$32 million increase in FAA funding for airports.
16:05 Slide 15
This slide summarizes the $50 million in 26 new projects prioritized by the Regional Planning
Commissions that are included in the current draft. The Regional Planning Commissions work with
communities to identify projects that address local and regional transportation needs. The Regional
Planning Commission ranks the projects based on set criteria and the highest-ranking projects that fit
within each regions allocation of funds were included in the draft.
16:31 Slide 16
There are 94 projects totaling $436 million in Executive Council District 1. Each project footprint and
project number is highlighted on the map to the right. The breakout by project type is listed in the table.
16:47 Slide 17
There are 70 projects totaling $789 million in Executive Council District 2. Each project footprint and
project number is highlighted on the map to the right. The breakout by project type is listed in the table.
17:00 Slide 18
Similarly, in District 3 there are 94 projects totaling $436 million dollars.
17:14 Slide 19
There are 54 projects totaling $1 billion in Executive Council District 4.
17:18 Slide 20
There are 58 projects totaling $350 million in Executive Council District 5.
17:24 Slide 21
We also invite everyone to complete a transportation survey. he survey will take about ten minutes to
complete and it includes a series of questions to find out what is important to you from a transportation
system standpoint. The survey is mobile device capable and can be found on the DOT’s Ten Year Plan
website.
17:42 Slide 22
We are making this presentation in 20 locations across the state during the months of September and
October. GACIT will reconvene in November to review all of the comments submitted and will utilize the
comments to modify the plan. The plan will be forwarded to the Governor by December 1 for
modifications. The Governor will then send the plan to the legislature by January 15 for further review
and revisions. The final 2021-2030 plan will be adopted into law in June 2020.
18:10 Slide 23
Thanks for your attention. Please visit the DOT’s Ten Year Plan website for further information.

10 Year Transportation Improvement Plan
Message from Commissioner Victoria Sheehan on the 10 Year Transportation Improvement Plan Public Hearings.
10 Year Transportation Improvement Plan
10 Year Transportation Improvement Plan
Transcript of video:
NHDOT 10-Year Transportation Improvement Plan Promotion Video Script
Hi Everyone, my name is Victoria Sheehan, Commissioner of the New Hampshire Department of
Transportation. Every two years the Department works with our Executive Council, the Governor and the
Legislature to update our 10-Year Plan on transportation.
As part of that process we have public hearings held by the Executive Councilors across the state.
Recognizing that everyone is very busy these days we wanted to embark on a new endeavor and that is
Virtual Public Involvement. In addition to the in-person public hearings, we’ve also developed a survey
and put some additional information on our website for you to view and participate in.
The website address is NH.Gov forward slash DOT and you will find a copy of the PowerPoint presentation
that we’ve been using at the Public Hearings as well as the interactive survey for you to participate in.
Our goal with the survey is to seek your feedback and make sure that we are making the right strategic
investments when it comes to transportation.
It is an interactive and dynamic survey and I encourage you all to take the time to complete it. I promise
it will be less than 10 minutes of your time.
So please visit the website. Again, the address is NH.Gov forward slash DOT. We want to make sure we
are making the right transportation choices and your feedback is critical to that process.

The Reconstruction of Exit 3 in Windham
The reconstruction of I-93 at Exit 3 in Windham was one of the most ambitious projects ever undertaken by the NHDOT, with the goal of improving safety and meeting the corridor's mobility needs. Completed in the Fall of 2016, the new I-93 corridor at Exit 3 allows for greater motorist efficiencies and safer operations.
The Reconstruction of Exit 3 in Windham
The Reconstruction of Exit 3 in Windham
Transcript of video:
NHDOT I-93 Exit 3 Video Script
0:00 The reconstruction of I-93 is one of the most ambitious projects the New Hampshire DOT has ever
undertaken with the simple goal of making the corridor safer and to meet the PRESENT AND FUTURE
mobility needs.
asdasdasdasd
0:13 The signing of the Federal Aid Highway Act of 1965 enabled states to plan and build their own
portions of the new interstate system. Prior to this authorization the states were left to build their own
highways. The best example of this is the FE Everett Turnpike in the center of the state and opened in
1957.
0:31 Starting in 1959 construction began on the NH portion of i_93. The original design of the interstate
was to be 2 lanes in each direction and was to accommodate between 60 and 70 thousand vehicles per
day.
0:44 Prior to the interstate in NH there was no I-93, just simply a north-south arterial and an east-west
connector.
0:56 By 1962, Route 111 and Route 111A are straightened and realigned to provide a smoother and
safer alignment. The original north-south artery is removed and the original northbound alignment and
original southbound alignment of I-93 are constructed and opened to traffic.
1:16 From the 1970’s all the way to the 2000’s, there is little to no change in alignment on Interstate 93.
There are still only two lanes of traffic in each direction and vehicle volumes start to increase at a rate
the roadway can no longer efficiently handle. Extensive studies are conducted to provide a solution to
address safety and congestion concerns.
1:36 In late 2008, construction within the Exit 3 corridor begins to realign the northbound direction and
construct the new exit 3 southbound off ramp.
1:51 In 2009, northbound traffic remains on the original northbound alignment and southbound traffic
remains on the original southbound alignment. Construction begins for the new northbound bridges
over Route 111A and Route 111. To accommodate future temporary traffic patterns, the construction of
an interim exit 3 southbound off-ramp begins.
2:11 In order to construct the new bridges and southbound off-ramp, blasting operations begin to
remove rock and ledge.
2:28 Once ledge is removed, the formwork for the northbound bridge abutments commences.
Foundations are set and bridge pier work begins.
2:57 Excavation and embankment construction takes place for southbound off-ramp.
3:02 By 2010, traffic in both directions remain on their original alignments. Northbound bridge work
continues and exit 3 northbound mainline construction begins.
3:17 Steel beam superstructures are set for northbound bridges. Decks are placed, waterproof
membranes are installed, and bridge decks undergo the paving process.
3:29 Massive blasting operations continue to clear ledge and rock for the construction of the new
northbound alignment as well as interim crossovers at the north and south ends of the exit 3 area to
transition traffic to the existing southbound lanes.
3:42 By November 2010, the northbound bridges have been completed.
3:55 In 2011, northbound mainline construction continues as blasting, earthwork, grading and paving
are underway.
4:16 By Fall 2011, the new northbound alignment within the exit 3 corridor is completed. Interim
crossovers have been constructed and the interim southbound off-ramp is opened.
4:28 Northbound traffic remains on the original northbound alignment.
4:33 The original southbound alignment closes for southbound bridge and mainline widening
construction. As such, southbound traffic is diverted to the new northbound alignment via interim
crossovers. This new traffic pattern improves the safety and capacity of the interchange, removes two
red-list bridges from service and will minimize recurring traffic backups during the southbound morning
commute.
4:57 In 2012 construction begins for the new southbound bridges over Route 111A and Route 111.
Bridge demolition work to remove old I-93 southbound bridges take places in early 2012 and is followed
by southbound bridge abutment construction.
5:30 In 2013, southbound bridge construction continues. Steel beam superstructures are installed.
5:52 Decks are placed and paved. By the end of 2013, the southbound bridges have been completed.
6:06 Also in 2013, the new southbound widened alignment begins to form. Blasting operations take
place to accommodate for the new alignment.
6:17 Earthwork, Drainage and Grading operations take place along the new southbound alignment.
6:28 In 2014, construction for the new Route 111 Alignment begins. Blasting operations remove ledge to
make way for roadway construction.
6:45 Exit 3 Northbound on- and off-ramp construction begins as major ledge removal is performed and
embankments are constructed.
7:18 The new southbound mainline alignment undergoes paving operations.
7:28 September 2014, southbound traffic is diverted off the new northbound alignment onto the new
final southbound alignment.
7:40 In November 2014, northbound traffic is diverted from the original alignment to the modified final
northbound alignment.
7:54 By 2015, traffic is traveling on the new mainline northbound and southbound alignments within the
Exit 3 corridor. New modified southbound on-and-off ramps are in use as well as the newly constructed
northbound off-ramp. The existing northbound-on ramp is still in use as construction continues for new
ramp.
8:16 The new Route 111 alignment continues to take form in 2015
8:41 By August, Route 111 traffic is shifted to the new alignment from the Windham Post Office to the
old I-93 northbound bridge. Southbound on-and off-ramps are modified to accommodate traffic to the
new Route 111 alignment.
8:54 Old I-93 bridges are removed and the newly aligned Route 111 traffic begins to use the newly
constructed northbound on-ramp.
9:03 By 2016, the exit 3 interchange is completed as all on- and off-ramps have been constructed and
are in use. In 2016, Route 111A realignment begins as well as the realignment of Route 111 east of the
northbound ramps. The Exit 3 park and ride construction contract commences.
9:24 Fast forward to Fall 2016, The exit 3 corridor is complete. New Interstate 93 alignments allow for
greater efficiency and safer operations. Route 111 and Route 111A have been realigned to improve
mobility and access to interstate 93.
9:40 Over the past several years, NHDOT has taken I-93 from a congested state, through an extensive
and complex construction period, to an efficient major highway system providing safe and efficient
operations. Today, operations within the exit 3 corridor are exceeding expectations, allowing for more
capacity as traffic volumes continue to increase in the surrounding area.
10:05 To encourage carpooling and public transportation connections, a park and ride lot was opened in
late 2017 off the exit 3 interchange. The lot provides 140 spaces for vehicles.
10:16 This completion of this project marks a drastic pivot point in the maintenance and improvement
of the quality of life for New Hampshire residents as I-93 continues to provide a critical link between the
communities in south central New Hampshire and the greater Boston metropolitan area.

Airport System Plan
New Hampshire's airports are an important part of the state's transportation network, connecting people, communities, and business. This video details the importance of aviation and maintaining and developing the system of public use airports in the Granite State.
Airport System Plan
Airport System Plan
Transcript of video:
The NH Sate Airport System Plan consists of 25 public use facilities throughout the state.
Today this system has matured into a well balanced and effective part of New Hampshire’s transportation network.
Aviation is an important piece in supporting economic development in the State of New Hampshire.
We have 25 airports throughout the state of NH and millions of people travel in and out by way of those airports.
It is a system and once an airport is gone it does not come back.
What we have been able to do is bring in more business customers, business-friendly aircraft, larger aircraft, more first-class seating, that attracts business customers.
The reason why our plants and clients are successful is because they can fly to the closest airport and that has significant economic impact on those airports.
New Hampshire is a great location for doing business because we have not only access to international airports we have three major interstates that bisect out state and we are a pretty small state. It is significant that have so many. We also have a deep-water port over in Portsmouth. No matter what type of transportation need you might have, we can meet that need.
Transportation is all about connectivity and making sure that people can get to where they want to go. Our multi-modal transportation system – be It aviation, public transit, roads and bridges, rail, it is all about connectivity.
One of the main components of this airport is the fact that it is huge economic engine for southern NH and our region. A one-billion-dollar economic engine. 61% of that economic engine comes from people who don’t even live here.
Tourism is a big part of our state economy, employing about 70,000 people in NH. Many of the people who make NH the home for the business first encountered our state as a visitor/tourist. Tourism and the airports are really important because it is actually one of our best business development tactics.
In 2014 our payroll exceeded $17 million, about 85% of our employees are in NH. We spend about a quarter of a million dollars in fees, aviation and aeronautics fees, paid to the Aeronautics Department of NH. So just here in Portsmouth we have purchased over $1 million worth of fuel. We pay landing and parking service fees where we land. We strongly identify with NH. We are very pleased for the environment it provides for us.
The opening of Raymond Wieczorek Drive was a game changer, I think, for the Manchester area and for the airport in particular. It has opened up nearly a 1000 acres south of the airport for new economic development. We are looking at a million square feet of new development there. And about 700 new jobs that are going to come in. It is very substantial, and I think that it is all due to the investment in that infrastructure.
The airports also provide logistical support for law enforcement, air ambulances, and are ideal command centers for search and rescue operations.
NHDOT Bureau of Aeronautics is responsible for overseeing the entire airport system. They work to construct and maintain the best possible air transportation system and facilities in the most efficient and economical manner.
The Bureau works with agencies at the federal, state, and local levels to preserve and promote a system of airports necessary to the future of air transportation in NH.
Preserving the system that we have in place is crucial, and that’s part of what our new airport system plan does. It provides what that system is, what it looks like, what the roles and responsibilities of each of our airports are and that is crucial in preserving those roles and responsibilities.
Several recent studies to measure the economic benefits of aviation on NH show that the 25 airports provide over $1.16 billion of economic benefits to the state each year. This represents about 2% of NH’s overall economic output and over 9200 jobs. In addition, the study found that aviation is a significant source of tax revenue for the state.
NH’s aviation manufacturing companies add nearly another $1 billion of indirect economic output and bring over 3600 additional jobs to the state.
Many of these jobs are based in science, technology, engineering, and math. They help to attract and cultivate a highly skilled aviation and aerospace workforce.
A lot of the people who we hire are people who come from the STEM group- think of pilots- that is a highly technical position. Think of our accounting planning and business development departments. If you can’t run a scenario, if you can’t crunch numbers, you won’t be successful. I would say that nearly every angle of our business here absorbs and relies on STEM education.
Projections show that operations at NH airports, like other New England states, will remain stable and see modest growth over the next 20 years. During that time, our airports will need a projected $509 million in safety and capacity improvements.
Without public support none of the projects, none of the airports that we have in the state, would survive. The federal government it great at providing some funding to help and keep our airports safe and improve them and expand them. We also need state and local support for that. If we do not have the public support for those airports, then we won’t be able to realize the funding that we need to maintain and keep them safe and accessible for citizens.
NH’s 25 public use airports bring so many benefits to the state that is supporting them is paramount to meeting the economic and transportation needs of its many residents and visitors for years to come.

How to Drive a Two Lane Roundabout
This video uses the Lee roundabout to demostrate the traffic patterns in a two lane roundabout.
How to Drive a Two Lane Roundabout
How to Drive a Two Lane Roundabout
Transcript of video:
The two-lane roundabout in Lee, New Hampshire at the intersection of US Route 4 and NH Route 125 was constructed to solve traffic congestion and address safety issues. Roundabouts are often used at intersections to efficiently manage competing traffic volumes. Roundabouts can manage traffic more efficiently than comparably sized signalized intersections because they allow conflicting traffic to move concurrently. Roundabouts also eliminate the lost time that traffic signals must provide between conflicting traffic movements. Driving in a two-lane roundabout can be a bit different than your traditional single-lane roundabout…but it’s easy to learn how to drive in one. It’s important that you remember to always yield to both lanes of traffic when entering the roundabout. Never enter the roundabout alongside a vehicle that is already in the inner lane…because that vehicle may need to cross your path to exit. A major rule for driving in a two-lane roundabout is knowing which lane you need to be in to make the maneuver you want…and to always stay in that lane. Changing lanes, as shown, will cause confusion to other drivers and increase the likelihood of a crash. So how do you figure out which lane you should be in? A two-lane roundabout, like any multiple-lane intersection, has different movements permitted for each lane. The sign on the left, which indicates the lane can go straight or turn right, has the same message as this sign, which is a roundabout sign indicating the very same driver's actions. It may look funny…but the roundabout sign is signaling that those who want to exit the roundabout at the first or second exit will take this lane. If you want to take the third exit, you would use the left lane with this marking. You can also use the left-hand lane to take the second exit. So why can’t you use the right lane to take the third exit? Well…It’s so you don’t cause congestion and confusion within the roundabout…and to avoid a crash conflict point at the second exit. Without this order….a two‐lane roundabout will essentially function as a single-lane roundabout, which reduces capacity and increases congestion. There is no exception to the lane rule, even for large tractor-trailers. To assist those large trucks that are making their way through the roundabout, the NHDOT has installed mountable concrete aprons. Truck aprons provide extra width for a tractor trailer’s rear tires…in order for them to stay in their lane to make the thru or left-hand turn… so incidents, like this one, don’t happen. For more information about roundabouts…visit the NH Department of Transportation website.
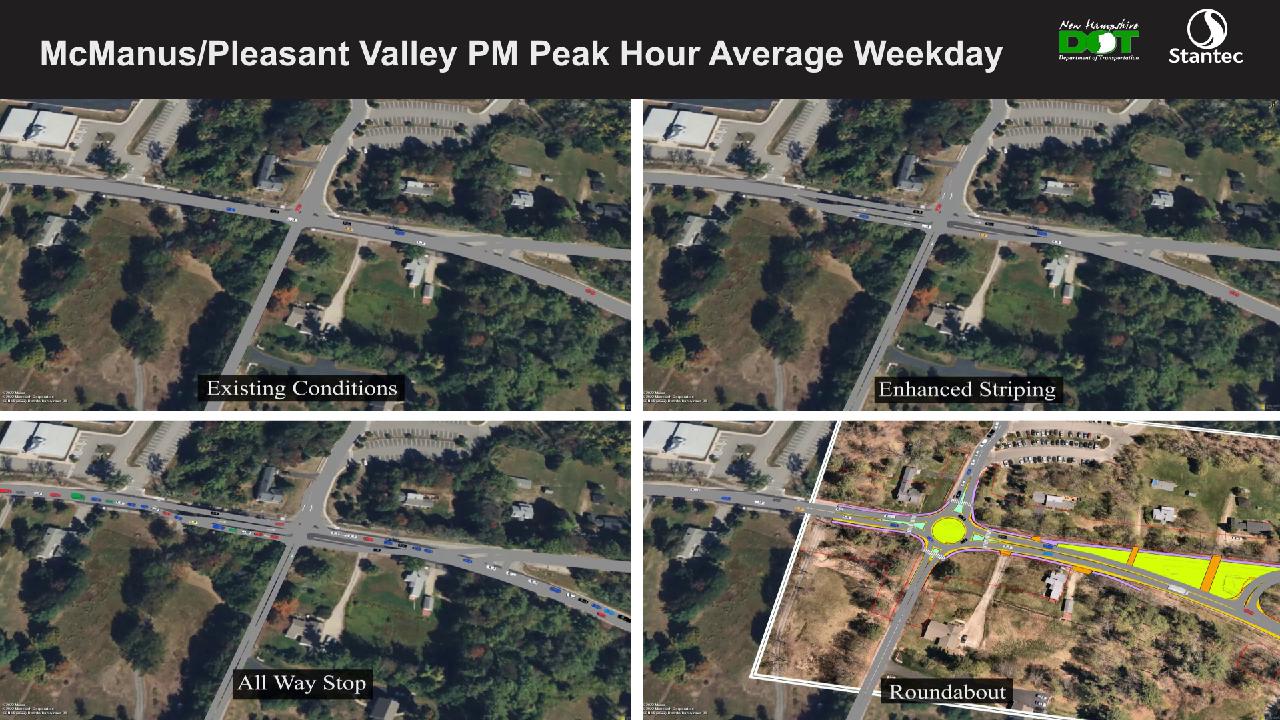
McManus/Pleasant Valley Intersection Animation
This animation depicts the motor vehicle traffic flow for the McManus-Pleasant Valley intersection on NH Route 28 in the Town of Wolfeboro, NH.
McManus/Pleasant Valley Intersection Animation
McManus/Pleasant Valley Intersection Animation
Transcript of video:
This animation depicts the motor vehicle traffic flow for the McManus-Pleasant Valley intersection on NH Route 28 in the Town of Wolfeboro, NH. The animation simulates vehicles using the intersection in three traffic scenarios in the year 2025: Weekdays during the peak morning commute; Weekdays during peak afternoon commute; And in the afternoon during the peak summer season in this popular tourist destination. In each traffic scenario, the animation includes the existing intersection and three proposed road improvement plans that are being considered. The proposed plans include enhanced road pavement markings, all way stop or stop condition for each intersecting street, and construction of a roundabout.
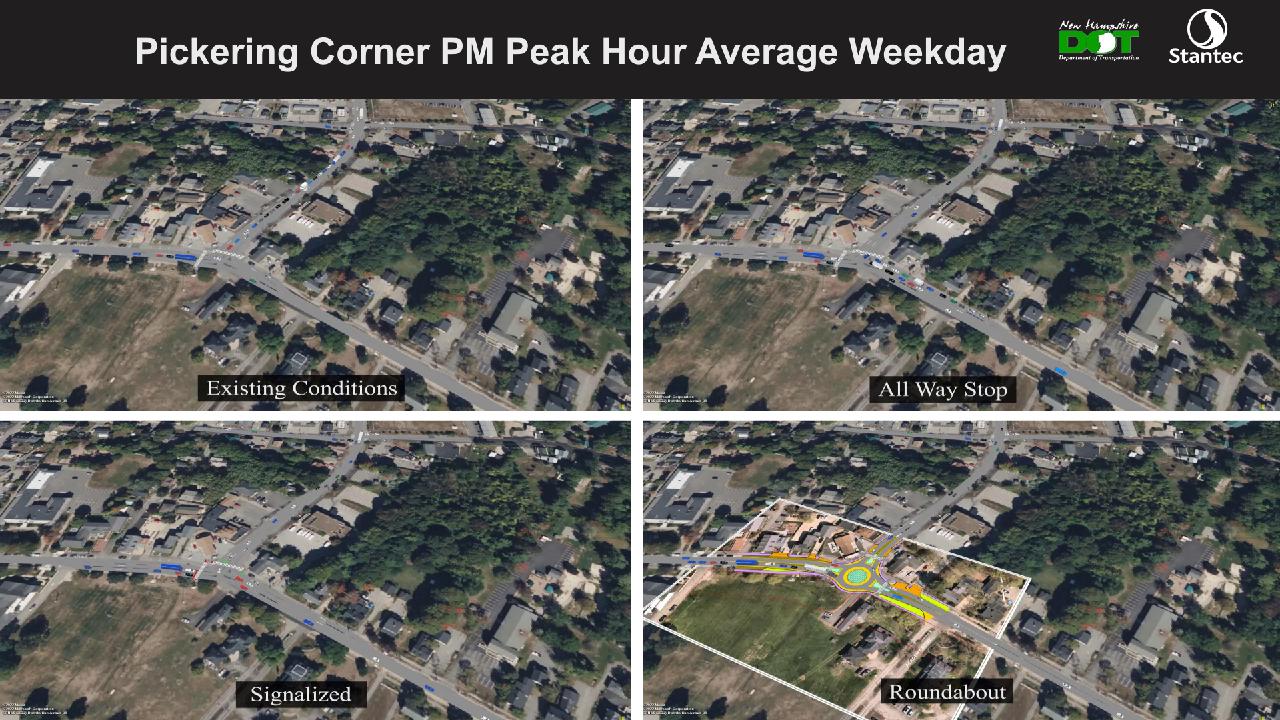
Pickering Corner Animation
This animation depicts the motor vehicle traffic flow for the Pickering Corner intersection on NH Route 28 in the Town of Wolfeboro, NH.
Pickering Corner Animation
Pickering Corner Animation
Transcript of video:
This animation depicts the motor vehicle traffic flow for the Pickering Corner intersection on NH Route 28 in the Town of Wolfeboro, NH. The animation simulates vehicles using the intersection in three traffic scenarios in the year 2025: Weekdays during the peak morning commute; Weekdays during peak afternoon commute; And in the afternoon during the peak summer season in this popular tourist destination. In each traffic scenario, this animation also includes the existing intersection and three proposed road improvement plans that are being considered. These plans include an all way stop or stop condition for each intersecting street, installing traffic signals, and construction of a roundabout.
Lancaster-Shelburne 40844 Public Informational Meeting
Lancaster-Shelburne 40844 Public Informational Meeting
Lancaster-Shelburne 40844 Public Informational Meeting
Transcript of video:
0:0:0.0 --> 0:0:0.990
Spetelunas, Corey
Good evening everyone.
0:0:1.0 --> 0:0:10.220
Spetelunas, Corey
It's a few minutes before 6, but to a few people more time here just want to make sure you guys know my mic's working and we'll get started here shortly.
0:2:54.160 --> 0:2:57.630
Spetelunas, Corey
Right at 6:00 o'clock, when I give people just a couple more minutes.
0:2:57.640 --> 0:2:59.430
Spetelunas, Corey
Here I do wanna respect your time.
0:2:59.440 --> 0:3:3.350
Spetelunas, Corey
So like 3 more minutes and we'll, we'll get this thing rolling.
0:3:3.450 --> 0:3:7.930
Spetelunas, Corey
It's not a super long presentation, so I don't want people to miss too much of it if possible.
0:5:52.340 --> 0:5:53.770
Spetelunas, Corey
Alright, let's get this show on the road.
0:5:53.780 --> 0:5:55.430
Spetelunas, Corey
I told you three months we'll do 3 minutes.
0:5:56.240 --> 0:5:57.470
Spetelunas, Corey
So welcome everyone.
0:5:57.560 --> 0:6:9.710
Spetelunas, Corey
This is the Randolph specific public informational meeting for the Lancaster, Shelburne, 4088, Rumble Strip project, along with two you will notice that I am doing this webinar style.
0:6:9.720 --> 0:6:14.120
Spetelunas, Corey
So you're microphone and video are disabled by default.
0:6:14.480 --> 0:6:20.730
Spetelunas, Corey
You should be able to do chats if you have any questions during the presentation.
0:6:20.740 --> 0:6:24.410
Spetelunas, Corey
Feel free to throw them in the chat at the end of this.
0:6:24.560 --> 0:6:26.430
Spetelunas, Corey
We also have a a hand function.
0:6:26.440 --> 0:6:32.800
Spetelunas, Corey
If you're unfamiliar with teams along the top of your screen, there is a hand that says raise underneath it.
0:6:34.600 --> 0:6:35.310
Spetelunas, Corey
Let me get to the end.
0:6:35.320 --> 0:6:41.390
Spetelunas, Corey
If you want to raise your hands using that button, I can unmute your microphone and turn your video or enable your video.
0:6:41.440 --> 0:6:47.40
Spetelunas, Corey
So if you want to use it, you can turn it on and ask a question in in person if you will.
0:6:48.450 --> 0:6:53.250
Spetelunas, Corey
Otherwise the chat is totally acceptable and we'll get this thing started.
0:6:54.990 --> 0:7:3.160
Spetelunas, Corey
So before we dive too much into this, I know there's not a huge crowd here, but I did wanna do a quick polling question of I can get this thing to work.
0:7:3.250 --> 0:7:3.550
Spetelunas, Corey
Let's see.
0:7:4.430 --> 0:7:4.740
Spetelunas, Corey
Watch.
0:7:6.220 --> 0:7:8.460
Spetelunas, Corey
So you should have a poll that just popped up on your screen.
0:7:9.970 --> 0:7:12.340
Spetelunas, Corey
Curious my first question here is what town do you live in?
0:7:12.470 --> 0:7:16.190
Spetelunas, Corey
I'm assuming most of it is Randolph, but give you the opportunity there.
0:7:21.490 --> 0:7:26.910
Spetelunas, Corey
And the second question is, how did you hear about this meeting?
0:7:29.520 --> 0:7:30.340
Spetelunas, Corey
That works due June.
0:7:30.350 --> 0:7:30.640
Spetelunas, Corey
Thank you.
0:7:35.190 --> 0:7:36.840
Spetelunas, Corey
But I have to fill it out, so I love.
0:7:41.130 --> 0:7:41.640
Spetelunas, Corey
For myself.
0:7:47.500 --> 0:7:50.410
Spetelunas, Corey
Shipping that launch maybe it didn't, but that's OK.
0:7:58.450 --> 0:8:3.280
Spetelunas, Corey
So OK, if you guys don't mind, looks like I'm phone questions might not have launched the way I wanted it to.
0:8:3.290 --> 0:8:8.320
Spetelunas, Corey
So I'm feeling my typing in the chat just again where you live and how you heard about the meeting.
0:8:9.120 --> 0:8:18.310
Spetelunas, Corey
I did try to send out some of physical mailings through USPS I that was kind of short notice, so I don't know if that's actually got to you or not.
0:8:18.320 --> 0:8:20.140
Spetelunas, Corey
So kind of curious of that primarily.
0:8:21.590 --> 0:8:23.180
Spetelunas, Corey
So let's get this thing started.
0:8:23.370 --> 0:8:27.730
Spetelunas, Corey
Like I mentioned, this is for the Rumble Strip installation project along US Route 2.
0:8:28.730 --> 0:8:35.280
Spetelunas, Corey
Umm, I should also mention this is being hoarded so and that's although I don't plan on posting this on the website.
0:8:35.290 --> 0:8:39.690
Spetelunas, Corey
If you do have any follow up questions or concerns about that, let me know.
0:8:42.550 --> 0:8:44.70
Spetelunas, Corey
I put my cursor on the PowerPoint.
0:8:44.80 --> 0:8:49.420
Spetelunas, Corey
This will work OK, so as you're well aware, This Is Us Route 2.
0:8:49.510 --> 0:8:50.590
Spetelunas, Corey
This is the project location.
0:8:51.950 --> 0:9:3.930
Spetelunas, Corey
Originally set to go from Lancaster all the way with the border of Vermont along the length of Route 2 for the most part to the border of Maine in Shelburne.
0:9:4.980 --> 0:9:6.360
Spetelunas, Corey
Umm that had a few.
0:9:7.830 --> 0:9:8.730
Spetelunas, Corey
Requirements and.
0:9:11.250 --> 0:9:20.510
Spetelunas, Corey
Criteria that needed to go along with it, that will we'll talk about, but the project length was entirely over to umm to begin.
0:9:22.560 --> 0:9:27.780
Spetelunas, Corey
So quick agenda, what we're going to discuss today, project purpose and crash information, why?
0:9:27.850 --> 0:9:29.460
Spetelunas, Corey
Why are we putting normal strips up on Route 2?
0:9:30.420 --> 0:9:30.970
Spetelunas, Corey
I'm safe.
0:9:31.30 --> 0:9:32.250
Spetelunas, Corey
Safety countermeasure.
0:9:32.300 --> 0:9:34.570
Spetelunas, Corey
Why are rumble strips effective?
0:9:34.580 --> 0:9:47.390
Spetelunas, Corey
Essentially, specific locations that we're proposing to put in rumble strips, the next steps of this project after this meeting and then Q&A comments however you want to communicate.
0:9:47.400 --> 0:9:47.760
Spetelunas, Corey
It's fine.
0:9:47.770 --> 0:9:48.900
Spetelunas, Corey
I mean, we'll do that at the end.
0:9:51.260 --> 0:10:0.760
Spetelunas, Corey
So before I dive too much into the purpose of the project, it just have a a question and and you guys are all knowing your, you know, homes presumably.
0:10:1.850 --> 0:10:9.370
Spetelunas, Corey
So I don't necessarily need a chat input or or raising their hand or anything, but I'm just kind of self reflection.
0:10:9.480 --> 0:10:11.770
Spetelunas, Corey
How many people have while they're driving?
0:10:12.420 --> 0:10:14.970
Spetelunas, Corey
I'm departed your lane. Right?
0:10:14.980 --> 0:10:20.100
Spetelunas, Corey
How many laid departures have you personally but experienced? Umm.
0:10:20.250 --> 0:10:24.830
Spetelunas, Corey
And then kind of a follow up to that then I'm guessing you know I was asked that same question.
0:10:24.840 --> 0:10:26.680
Spetelunas, Corey
I was like, no, I'm pretty good driver.
0:10:26.770 --> 0:10:27.850
Spetelunas, Corey
Like I don't leave my line.
0:10:28.770 --> 0:10:34.740
Spetelunas, Corey
Ohh follow question the the lane departure isn't necessarily defined by hitting something.
0:10:34.990 --> 0:10:49.180
Spetelunas, Corey
Being involved in a crash or even a near miss with person vehicle object what have you, or even that your vehicle is, you know, maybe fully in a different lane or shoulder.
0:10:49.330 --> 0:10:50.510
Spetelunas, Corey
You know you've left your lane entirely.
0:10:51.620 --> 0:10:58.260
Spetelunas, Corey
Lane departure is defined as your vehicle has in some way gone over the yellow or white line.
0:10:59.120 --> 0:11:5.330
Spetelunas, Corey
Whether that's a wheel width or half your car you have departed your land, right?
0:11:5.340 --> 0:11:13.60
Spetelunas, Corey
And I'm sure most of us have due to whatever you know, you're helping your your kids with something in the back seat.
0:11:15.10 --> 0:11:15.920
Spetelunas, Corey
Just sneeze.
0:11:16.510 --> 0:11:20.560
Spetelunas, Corey
You see something at your window and you just drift any of those apart.
0:11:20.570 --> 0:11:22.340
Spetelunas, Corey
There a reason you drowsy?
0:11:22.650 --> 0:11:24.140
Spetelunas, Corey
Hopefully you're not driving impaired.
0:11:24.430 --> 0:11:25.220
Spetelunas, Corey
Maybe you check your phone.
0:11:26.560 --> 0:11:29.240
Spetelunas, Corey
It's it's very, very easy here to leave your lane.
0:11:31.700 --> 0:11:34.450
Spetelunas, Corey
So we're gonna focus on, you know what?
0:11:34.460 --> 0:11:35.590
Spetelunas, Corey
What is the lane departure here?
0:11:36.100 --> 0:11:36.330
Spetelunas, Corey
What?
0:11:36.340 --> 0:11:37.90
Spetelunas, Corey
What are the results?
0:11:38.240 --> 0:11:38.580
Spetelunas, Corey
Uh.
0:11:38.620 --> 0:11:46.280
Spetelunas, Corey
If you crossed the center line, we're talking the W line and all the road, there's really four primary outcomes, if you will.
0:11:47.120 --> 0:11:48.790
Spetelunas, Corey
Uh, you could hit somebody coming the other way.
0:11:48.800 --> 0:11:49.480
Spetelunas, Corey
Head on crash.
0:11:49.920 --> 0:11:56.710
Spetelunas, Corey
You could leave the roadway on the far side of the road and that could lead to one of two options.
0:11:57.20 --> 0:11:57.940
Spetelunas, Corey
Hopefully not.
0:11:58.390 --> 0:11:59.650
Spetelunas, Corey
Your car could overturn.
0:12:1.580 --> 0:12:8.530
Spetelunas, Corey
Or you could, you know, hit something, usually a tree, a guardrail, something of that manner. Umm.
0:12:8.540 --> 0:12:8.740
Spetelunas, Corey
What?
0:12:8.750 --> 0:12:10.480
Spetelunas, Corey
You've crossed the other direction.
0:12:10.550 --> 0:12:18.360
Spetelunas, Corey
You've gone over the white line to your right and you've left the roadway that way, which would have the same ultimate result.
0:12:19.360 --> 0:12:22.170
Spetelunas, Corey
Overturn or impact of the fixed object.
0:12:22.440 --> 0:12:27.740
Spetelunas, Corey
Again, hopefully not, but those are your your potential outcomes.
0:12:30.610 --> 0:12:36.870
Spetelunas, Corey
So Amanda, who's on the call with us here, has dug up some some crash data.
0:12:37.0 --> 0:12:47.310
Spetelunas, Corey
They're crash data guru for for uh crash data that's happened between July 2017 and December 2022.
0:12:48.200 --> 0:12:53.390
Spetelunas, Corey
A longer two in the five towns that the follow that route.
0:12:53.720 --> 0:12:56.210
Spetelunas, Corey
Ohh and these are.
0:12:58.440 --> 0:13:1.380
Spetelunas, Corey
I don't wanna say, oh, crashes cause not all crashes are documented.
0:13:3.190 --> 0:13:7.130
Spetelunas, Corey
And this run off the road number there is that little asterisk next to type of crashes.
0:13:8.610 --> 0:13:10.920
Spetelunas, Corey
OK, mentioned that's only for documented crashes.
0:13:11.130 --> 0:13:18.540
Spetelunas, Corey
There's plenty of crashes that, you know, maybe it's a vendor Bender, maybe somebody hit a tree and you know it was a ashamed of it.
0:13:18.550 --> 0:13:19.370
Spetelunas, Corey
And didn't call the police.
0:13:20.750 --> 0:13:28.450
Spetelunas, Corey
Umm it it's not gonna be all but also this right off the road number is for Edge line crosses only.
0:13:28.860 --> 0:13:32.670
Spetelunas, Corey
You know you run off the road to the right and and that's basically you run off the road.
0:13:33.600 --> 0:13:42.640
Spetelunas, Corey
It doesn't include the center line crashes that may have hit another vehicle that that, that, that's that's partially due to our crash data as the whole different discussion.
0:13:43.650 --> 0:13:46.850
Spetelunas, Corey
Umm, but there's a lot of good information still here.
0:13:48.240 --> 0:13:50.380
Spetelunas, Corey
Umm, so if we focus on on Randolph.
0:13:52.800 --> 0:14:1.450
Spetelunas, Corey
Excuse me, I think it's still the percentage of run off the road crashes for the total number of crashes we have documented in Randolph.
0:14:2.300 --> 0:14:6.460
Spetelunas, Corey
It's 58% and that that's a huge, huge number.
0:14:8.190 --> 0:14:18.250
Spetelunas, Corey
There's 114 total on US Route 2 through this, you know 5 1/2 year data range, but 58% of them are.
0:14:19.600 --> 0:14:21.380
Spetelunas, Corey
I run off the roads in the town of Randolph.
0:14:23.430 --> 0:14:24.410
Spetelunas, Corey
We break that down one more.
0:14:26.220 --> 0:14:33.650
Spetelunas, Corey
You can see the number of crashes that actually resulted injuries and then these hopefully again are are documented.
0:14:34.140 --> 0:14:34.990
Spetelunas, Corey
There could be more.
0:14:35.0 --> 0:14:39.210
Spetelunas, Corey
There could be less or there might not be less, or there could be more.
0:14:39.220 --> 0:14:48.950
Spetelunas, Corey
Certainly, though, you'll see that there's there's eleven of the 35 crashes we have documented in Randolph that have run off the road.
0:14:49.280 --> 0:15:7.860
Spetelunas, Corey
And again, this does not include crossing the center line and eventually getting a vehicle because those would be much more severe and we we know about them, they just weren't in this dissemination of Theta 11 of them resulted in grass and not injuries.
0:15:8.250 --> 0:15:22.490
Spetelunas, Corey
So 1/3 of the crashes that ran off the road hurt somebody to some degree, whether it was a minor injury, serious injury, or potentially fatal, a third of them result in someone getting injured.
0:15:26.250 --> 0:15:32.560
Spetelunas, Corey
And also see that 48% of the total injury crashes in Randolph resulted in industry again.
0:15:34.680 --> 0:15:35.470
Spetelunas, Corey
Minor injury.
0:15:35.700 --> 0:15:36.630
Spetelunas, Corey
Serious injury.
0:15:36.760 --> 0:15:40.480
Spetelunas, Corey
Fatal injury, but they're all lumped together in injury.
0:15:41.740 --> 0:15:45.320
Spetelunas, Corey
There are further breakdowns, but for this discussion we'll just call it injury.
0:15:47.150 --> 0:15:54.520
Spetelunas, Corey
Something that when I was looking at this data, but I found interesting was if you're looking at this top table here.
0:15:56.950 --> 0:16:8.850
Spetelunas, Corey
The percent run off the road crashes in Gorham and Lancaster are pretty low by 3% and 6% respectively, and a lot of that has to do with the posted speed.
0:16:10.740 --> 0:16:18.930
Spetelunas, Corey
You know, Gorm and Lancaster have some some downtown areas that are closer to, you know, 30 miles an hour or densely populated.
0:16:19.120 --> 0:16:24.670
Spetelunas, Corey
They they naturally, umm, calm the traffic.
0:16:25.980 --> 0:16:32.160
Spetelunas, Corey
Traffic slows down that you know the character of the road has changed enough that people naturally slowed down.
0:16:33.420 --> 0:16:35.140
Spetelunas, Corey
Randolph doesn't have that luxury.
0:16:35.590 --> 0:16:38.210
Spetelunas, Corey
They have wide roads.
0:16:38.420 --> 0:16:39.970
Spetelunas, Corey
They say that you have wide roads.
0:16:40.920 --> 0:16:43.250
Spetelunas, Corey
Umm, not much going on.
0:16:43.560 --> 0:16:51.10
Spetelunas, Corey
A lot of woods houses that back a higher speeds is a is where that equation goes.
0:16:52.930 --> 0:17:0.830
Spetelunas, Corey
Umm also worth noting, 10% of the crashes again from this top table of.
0:17:0.840 --> 0:17:1.550
Spetelunas, Corey
It's in my cursor but.
0:17:3.740 --> 0:17:4.100
Spetelunas, Corey
Excuse me.
0:17:5.950 --> 0:17:7.340
Spetelunas, Corey
10% of the total crashes.
0:17:9.0 --> 0:17:12.180
Spetelunas, Corey
Umm, I shouldn't say that cause a little under 10%.
0:17:13.160 --> 0:17:21.220
Spetelunas, Corey
We're right off the roads, but 21% of the run off the roads resulted in an injury.
0:17:23.230 --> 0:17:24.60
Spetelunas, Corey
For run off the roads.
0:17:26.270 --> 0:17:27.460
Spetelunas, Corey
When do you play with buttons over there?
0:17:34.140 --> 0:17:42.660
Spetelunas, Corey
So if we have 10% of crashes that are running off the road, but 21% of them are injuring someone, that's that's notable.
0:17:44.10 --> 0:17:55.570
Spetelunas, Corey
If you look at your other crash column, 13% of those result in injury, so the the one of the roads are are injuring at a higher rate than the non run off the roads.
0:18:2.50 --> 0:18:2.740
Spetelunas, Corey
So I wanted to touch.
0:18:3.440 --> 0:18:8.550
Spetelunas, Corey
That's good, but it's just based on some some big fatal statistics across the US.
0:18:10.600 --> 0:18:22.720
Spetelunas, Corey
So nationwide and this is 2023 information nationwide, there were about 44,000 deaths on the road, about 51% of those were due to lane departures.
0:18:23.650 --> 0:18:28.390
Spetelunas, Corey
And I think that's more inclusive of centerline and edgeline, but but that's the number we're looking out there.
0:18:29.740 --> 0:18:41.110
Spetelunas, Corey
Umm so that results in about 22 1/2 thousand people have died on the roads just from from leaving the road in some manner, leaving the road or crossing the line.
0:18:42.910 --> 0:18:43.250
Spetelunas, Corey
Umm.
0:18:43.750 --> 0:18:48.560
Spetelunas, Corey
Similarly, in New Hampshire, we had about 130 just last year.
0:18:49.460 --> 0:18:58.650
Spetelunas, Corey
Umm, like to think our our data is a little more uh, reliable in that regard, at least for last year.
0:19:0.620 --> 0:19:8.30
Spetelunas, Corey
And we had 51 attributed to a land departure of some sort which is 39% below the national average.
0:19:8.80 --> 0:19:14.420
Spetelunas, Corey
Sounds good, but that's still 51 people that have died because they they left their lane.
0:19:17.990 --> 0:19:25.650
Spetelunas, Corey
Something important here is that fatal crashes the location of that is very random.
0:19:26.570 --> 0:19:32.470
Spetelunas, Corey
I'm you could have all the criteria to have a bad crash, uh.
0:19:32.480 --> 0:19:37.630
Spetelunas, Corey
Whether it's high speed, poor geometry, see the comment about lighting.
0:19:37.640 --> 0:19:38.520
Spetelunas, Corey
Maybe it's very dark.
0:19:40.280 --> 0:19:45.810
Spetelunas, Corey
You you could have all of that and you know it's it's never an issue that really presents itself.
0:19:46.120 --> 0:19:47.480
Spetelunas, Corey
Nobody ever dies there.
0:19:48.930 --> 0:19:57.310
Spetelunas, Corey
Umm, but the trash types are predictable, so you would you would predict that something should happen.
0:19:57.320 --> 0:20:8.890
Spetelunas, Corey
There doesn't mean something well, but you would expect in in these locations with these criteria, something will eventually happened here. And uh, what?
0:20:8.900 --> 0:20:12.490
Spetelunas, Corey
We're kind of trying to address here is there is higher.
0:20:14.290 --> 0:20:27.540
Spetelunas, Corey
Chance of something happening, but lane departures in this particular situation along Route 2, then you know some other similar regulations, say 115, that's up in that area.
0:20:31.540 --> 0:20:34.400
Spetelunas, Corey
So three cap real quick, whatever it will strips.
0:20:35.500 --> 0:20:36.790
Spetelunas, Corey
Umm, I'm pretty confident.
0:20:36.800 --> 0:20:40.800
Spetelunas, Corey
Everybody on this call has driven somewhere that has rumble strips.
0:20:41.850 --> 0:20:44.880
Spetelunas, Corey
Umm, but we'll go through the exercise regardless, just to make sure.
0:20:44.890 --> 0:20:45.340
Spetelunas, Corey
On the same page.
0:20:46.970 --> 0:20:55.630
Spetelunas, Corey
So remove strips are a mild element on the pavement that's intended to alert drivers through vibration and sound that their vehicle has left the drive away.
0:20:56.350 --> 0:20:57.140
Spetelunas, Corey
The travel lane.
0:20:57.190 --> 0:21:1.370
Spetelunas, Corey
Sorry, rumble strips can be installed on the shoulder.
0:21:1.780 --> 0:21:8.300
Spetelunas, Corey
The White Edge line or near the yellow center line or on the yellow line?
0:21:9.700 --> 0:21:14.830
Spetelunas, Corey
Our rumble strips are typically on the shoulder offset from the white line by a foot.
0:21:15.740 --> 0:21:28.460
Spetelunas, Corey
This photo is not from New Hampshire, but it was a good representation of the Rumble Strip location in the shoulder, so it's like that was and want to share.
0:21:30.940 --> 0:21:34.160
Spetelunas, Corey
Uh, it's the quick clarifier.
0:21:34.570 --> 0:21:48.320
Spetelunas, Corey
If the rumble strip is placed on top of the pavement pavement marking it then becomes a rumble stripe because you put the pavement marking back on top of the rumble strip and they would also be the stripe.
0:21:48.330 --> 0:22:3.200
Spetelunas, Corey
So so the the point there is that when you repaint over the rumble strip it, it can actually increase the visibility of the pavement marking during wet conditions as well as at night.
0:22:4.690 --> 0:22:12.370
Spetelunas, Corey
And it it kind of increases the life of the pavement marking too, because the plows aren't necessarily scraping it up every time they pass.
0:22:13.320 --> 0:22:15.990
Spetelunas, Corey
Umm, the drivers drive on the line.
0:22:16.220 --> 0:22:18.460
Spetelunas, Corey
They're not getting that wear and tear on it.
0:22:19.260 --> 0:22:24.390
Spetelunas, Corey
Umm, so it it does kind of have a a side benefit of of longevity.
0:22:28.450 --> 0:22:29.680
Spetelunas, Corey
So so why?
0:22:29.750 --> 0:22:30.680
Spetelunas, Corey
Why rumble strips, right?
0:22:32.240 --> 0:22:39.990
Spetelunas, Corey
There's handfuls of different kind of measures that we could we can implement our too to try to get people to not run off the road, right.
0:22:41.210 --> 0:22:42.860
Spetelunas, Corey
There's a guardrail everywhere.
0:22:42.950 --> 0:22:49.720
Spetelunas, Corey
We good make the shoulders wider because down post the speed limit everywhere.
0:22:50.710 --> 0:22:56.200
Spetelunas, Corey
Umm, there's there's very different levels of effectiveness for that.
0:22:58.600 --> 0:23:29.910
Spetelunas, Corey
So we we base a lot of our our data analysis on a document called the Highway Safety Manual, which which essentially goes into some of that predictive crash rate stuff that I was talking about Lego where the fatals are random, but the crash locations are the crash types or not as well as something called the crash modification factor, which is what this first bullet kind of addresses.
0:23:31.280 --> 0:23:32.10
Spetelunas, Corey
They're they are.
0:23:32.140 --> 0:23:37.20
Spetelunas, Corey
These rumble strips are are proven to reduce fatal and injured crashes.
0:23:38.100 --> 0:23:40.720
Spetelunas, Corey
I mean, these are these are nationwide numbers.
0:23:42.120 --> 0:23:44.400
Spetelunas, Corey
I do have a New Hampshire example later that we can look at.
0:23:46.870 --> 0:23:54.20
Spetelunas, Corey
But there's the been documented to reduce head on crashes by anywhere between 44 and 64%.
0:23:56.180 --> 0:23:57.850
Spetelunas, Corey
I mean that's that's huge.
0:23:58.500 --> 0:24:4.510
Spetelunas, Corey
You save one in every two people from crossing that center line to hit somebody head on.
0:24:5.630 --> 0:24:9.0
Spetelunas, Corey
That's you know, how many lives are you saving that?
0:24:11.160 --> 0:24:20.790
Spetelunas, Corey
And following that, the next line, the reduction in single vehicle roadway departures likely crossing over the shoulder and leaving the roadway.
0:24:21.910 --> 0:24:24.830
Spetelunas, Corey
Uh reduce reduction of 13 to 51.
0:24:25.950 --> 0:24:30.870
Spetelunas, Corey
I know it's a very big range, but it's also dependent on a lot of different factors.
0:24:31.860 --> 0:24:32.210
Spetelunas, Corey
Uh-huh.
0:24:33.500 --> 0:24:38.510
Spetelunas, Corey
Roadway Wests roadway types speed plays into it.
0:24:40.140 --> 0:24:41.360
Spetelunas, Corey
How many vehicles are on the road?
0:24:42.500 --> 0:24:46.750
Spetelunas, Corey
Uh, there's there's a lot of different factors that will impact that number.
0:24:46.760 --> 0:24:50.660
Spetelunas, Corey
But yeah, but really any reduction is fantastic.
0:24:52.620 --> 0:25:1.700
Spetelunas, Corey
The low cost rumble strips are not that expensive to put in and and they they save lives very effectively.
0:25:2.880 --> 0:25:3.650
Spetelunas, Corey
I'm sure anybody.
0:25:3.660 --> 0:25:9.190
Spetelunas, Corey
That's in a rumble strip knows that they had a rumble strip and they they likely correct it.
0:25:10.990 --> 0:25:11.330
Spetelunas, Corey
Umm.
0:25:12.960 --> 0:25:15.390
Spetelunas, Corey
And also there's a short construction exposure.
0:25:16.140 --> 0:25:20.780
Spetelunas, Corey
So construction is is mobile, uh, it doesn't take that long.
0:25:22.50 --> 0:25:24.990
Spetelunas, Corey
Traffic is still moving for the most part.
0:25:25.680 --> 0:25:26.670
Spetelunas, Corey
Yeah, it's down to one lane.
0:25:26.680 --> 0:25:29.270
Spetelunas, Corey
It's very short.
0:25:30.810 --> 0:25:34.420
Spetelunas, Corey
Umm, inconvenience I guess.
0:25:37.80 --> 0:25:45.550
Spetelunas, Corey
There's a couple of links down here this this presentation will be posted online and if you're interested you can investigate these links.
0:25:50.860 --> 0:25:51.90
Spetelunas, Corey
Sure.
0:25:57.670 --> 0:26:1.640
Spetelunas, Corey
OK, so I mentioned earlier that rumble strips have have requirements.
0:26:3.650 --> 0:26:8.860
Spetelunas, Corey
The roadway needs to meet several requirements in order to qualify for almost trips.
0:26:8.870 --> 0:26:12.300
Spetelunas, Corey
Essentially, the first two are.
0:26:12.510 --> 0:26:14.960
Spetelunas, Corey
The road has to be posted at least 40 miles an hour.
0:26:15.810 --> 0:26:18.940
Spetelunas, Corey
Any lower than that and it's it's not on the list for rumbles.
0:26:19.990 --> 0:26:30.330
Spetelunas, Corey
Uh, and the payment has to be in good condition, so that point kind of goes back to why I originally sent the project originally, went from Lancaster to Shelburne.
0:26:31.570 --> 0:26:37.280
Spetelunas, Corey
I'm the project no longer includes Lancaster and and that's because the Batman condition.
0:26:44.780 --> 0:26:58.590
Spetelunas, Corey
Umm so to install a centerline rumble strip along the roadway it has to meet both those first two criteria we mentioned, but it also has to be at least 28 feet wide from after payment to edge of pavement.
0:27:0.720 --> 0:27:0.990
Spetelunas, Corey
Uh.
0:27:1.0 --> 0:27:3.510
Spetelunas, Corey
Turns out install a shoulder rumble strip.
0:27:4.60 --> 0:27:9.910
Spetelunas, Corey
Let's have at least a minimum 6 foot shoulder width, and that width actually widens out to 7 feet.
0:27:10.120 --> 0:27:18.30
Spetelunas, Corey
If there's a guard rail there, and that's because of my school traffic, the one to still accommodate space for the bicycles to be.
0:27:20.100 --> 0:27:24.280
Spetelunas, Corey
And not have to drive over the rumble service because that the whole that one.
0:27:29.850 --> 0:27:39.490
Spetelunas, Corey
So there are two types of rumble strips and conventionally this type would be the type of rumble strip that we would install.
0:27:40.980 --> 0:27:42.60
Spetelunas, Corey
They're rectangular.
0:27:42.70 --> 0:27:43.370
Spetelunas, Corey
Corrugated rumble strips.
0:27:43.780 --> 0:27:50.520
Spetelunas, Corey
They're 12 inch pattern, 7 inch mill with a 5 inch break kinda like that image on the bottom there.
0:27:52.410 --> 0:27:54.900
Spetelunas, Corey
And and still they're still out.
0:27:55.10 --> 0:27:55.340
Spetelunas, Corey
Right.
0:27:55.350 --> 0:27:55.940
Spetelunas, Corey
You'll hit them.
0:27:55.990 --> 0:27:56.640
Spetelunas, Corey
You'll know it.
0:27:57.70 --> 0:27:58.540
Spetelunas, Corey
You feel it in the car there.
0:27:58.730 --> 0:27:59.570
Spetelunas, Corey
I mean, they're effective.
0:28:0.880 --> 0:28:16.790
Spetelunas, Corey
Umm, I also wanna mention I mentioned the bicyclists in the last slide, our rumble strip patterns are, uh, a 60 foot cycle total and that would be 48 feet of a milled rumble strip.
0:28:17.840 --> 0:28:33.210
Spetelunas, Corey
Then with a 12 foot break for bicyclists, whether there's something in the shoulder that you to avoid or you know they need to make a turn, you know, whatever the the case may be, they can get out of the shoulder and not have to drive over the rumble strips.
0:28:37.460 --> 0:28:42.510
Spetelunas, Corey
Our second type of rumble strip, it's a sinusoidal rumble strip.
0:28:43.350 --> 0:28:46.760
Spetelunas, Corey
The husband, affectionately dubbed the Mumble strip.
0:28:48.380 --> 0:28:55.460
Spetelunas, Corey
This is kind of a sinusoidal pattern, a wave, if you will no 14 inch cycle.
0:28:56.780 --> 0:29:10.90
Spetelunas, Corey
Uh, same half an inch depth at its maximum, but these are designed to produce less exterior noise than than the previous version.
0:29:11.900 --> 0:29:23.640
Spetelunas, Corey
Umm these are installed in several places across the state, but you Hampshire 28 and Chichester 102 and ran and Raymond.
0:29:23.700 --> 0:29:30.780
Spetelunas, Corey
Excuse me 125 in Plasto 9 in Hillsboro the there's several others.
0:29:30.790 --> 0:29:36.620
Spetelunas, Corey
There's still relatively new, umm, but they're they're still just as effective.
0:29:40.240 --> 0:29:48.950
Spetelunas, Corey
So this is kind of the money slide and I'm, I'm sure the one that most people are are interested in the decibel level.
0:29:49.20 --> 0:29:51.730
Spetelunas, Corey
Ohh, how noisy are these rumble strips?
0:29:55.570 --> 0:30:2.350
Spetelunas, Corey
So before we get to the big info, we gotta kinda introduce decibels for anyone that isn't a sound engineer.
0:30:4.0 --> 0:30:10.220
Spetelunas, Corey
So it's a change between one to three decimals is is barely noticeable to the human ear.
0:30:11.760 --> 0:30:13.750
Spetelunas, Corey
Ohh, little bit larger than that.
0:30:13.890 --> 0:30:15.190
Spetelunas, Corey
5 decibel change.
0:30:15.840 --> 0:30:16.730
Spetelunas, Corey
You'll notice it.
0:30:17.0 --> 0:30:17.870
Spetelunas, Corey
It'll perk up.
0:30:17.880 --> 0:30:20.10
Spetelunas, Corey
You might look in the direction of whatever the noise is.
0:30:21.980 --> 0:30:26.660
Spetelunas, Corey
10 decibel level change is essentially doubling the noise level.
0:30:27.820 --> 0:30:39.570
Spetelunas, Corey
Uh, and the way it's gonna works is if if the decibel level is, say, 20 and something makes a 30 decibel level noise, it's going to sound twice as loud.
0:30:40.800 --> 0:30:41.160
Spetelunas, Corey
Umm.
0:30:41.420 --> 0:30:50.580
Spetelunas, Corey
Similarly, if something is at 70 decibels, and then you hear something at 80, it's still again twice as loud.
0:30:51.90 --> 0:30:57.720
Spetelunas, Corey
There's no ratio involved there, it's just every group of 10 is doubled.
0:30:58.880 --> 0:31:3.240
Spetelunas, Corey
Uh, similarly, every reduction in 10 is cut in half.
0:31:5.570 --> 0:31:8.370
Spetelunas, Corey
So this is taken from.
0:31:10.470 --> 0:31:17.630
Spetelunas, Corey
Some FHW a research that was done and I wanna point out a couple lines here.
0:31:19.570 --> 0:31:22.180
Spetelunas, Corey
Road noise at 65 miles an hour.
0:31:23.30 --> 0:31:33.610
Spetelunas, Corey
If you're standing at 200 feet away, I will be about 68 decibels, and and that's gonna vary depending on your vehicle. Umm.
0:31:36.20 --> 0:31:38.790
Spetelunas, Corey
I wanna say speed, but it's 65 miles an hour.
0:31:39.340 --> 0:31:40.950
Spetelunas, Corey
You're you're pavement type.
0:31:41.0 --> 0:31:41.770
Spetelunas, Corey
You know, stuff like that.
0:31:42.980 --> 0:31:46.470
Spetelunas, Corey
So it's not if you got a decibel level reader.
0:31:46.480 --> 0:31:48.330
Spetelunas, Corey
I'm sure there's more scientific games than that.
0:31:48.800 --> 0:31:50.550
Spetelunas, Corey
Then you stood 200 feet away.
0:31:51.220 --> 0:31:53.70
Spetelunas, Corey
You had your friend go 60 pound miles an hour.
0:31:53.680 --> 0:31:55.880
Spetelunas, Corey
It might not hit 68, but it'd be pretty close.
0:31:58.910 --> 0:32:7.40
Spetelunas, Corey
It's next one I wanna point out is passenger vehicle strike on a sinusoidal rumble strip, which is that way.
0:32:7.50 --> 0:32:15.380
Spetelunas, Corey
The one we just looked at at 60 miles an hour, most at Randolph I think is 50 to 55.
0:32:17.230 --> 0:32:26.310
Spetelunas, Corey
So although people really shouldn't be going 60 it it wouldn't surprise me if people do 60 and you'll notice that that's a decibel level change of six.
0:32:27.520 --> 0:32:38.460
Spetelunas, Corey
So based on what we just talked about, you'll notice it now five is relatively noticeable, 6 will be a little more readily noticeable. Umm.
0:32:40.850 --> 0:32:41.510
Spetelunas, Corey
Still earlier.
0:32:43.570 --> 0:32:45.150
Spetelunas, Corey
I'm moving on one step higher.
0:32:46.520 --> 0:32:53.720
Spetelunas, Corey
Ask him to vehicle strike on Rumble strip, which is the conventional rectangular ones about 55 miles an hour.
0:32:54.190 --> 0:32:55.310
Spetelunas, Corey
Is that 81?
0:32:56.810 --> 0:33:3.710
Spetelunas, Corey
So you'll notice, even though we're going 10 miles an hour less than our our baseline at 68.
0:33:5.120 --> 0:33:7.850
Spetelunas, Corey
Ohh, we're making 13 decibel levels.
0:33:8.80 --> 0:33:23.530
Spetelunas, Corey
More noise and and we've established that that is essentially twice as loud and more so because, you know, 1310 is double 13's more wasn't double the scientific way, I describe that.
0:33:27.730 --> 0:33:29.780
Spetelunas, Corey
So I I thought that was that was interesting.
0:33:30.390 --> 0:33:31.240
Spetelunas, Corey
I don't wanna.
0:33:31.250 --> 0:33:38.370
Spetelunas, Corey
I don't wanna try to sell some sort of rumble strips as a, you know, they're silent.
0:33:39.410 --> 0:33:40.120
Spetelunas, Corey
Rumble strips.
0:33:40.390 --> 0:33:47.150
Spetelunas, Corey
They they're less quiet, umm and and they're certainly better than the rectangular ones.
0:33:48.460 --> 0:33:50.40
Spetelunas, Corey
I did not mention and I should.
0:33:51.840 --> 0:33:55.630
Spetelunas, Corey
All of Route 2 we are proposing these sinusoidal rumble strips.
0:33:56.620 --> 0:34:0.830
Spetelunas, Corey
Our current guidance typically says the center line.
0:34:2.180 --> 0:34:3.160
Spetelunas, Corey
I know the backwards.
0:34:3.980 --> 0:34:8.390
Spetelunas, Corey
I think it's a center line would be the rectangular rumbles bomb.
0:34:9.320 --> 0:34:17.430
Spetelunas, Corey
But but I mean we we understand the noise concerns and at the they're virtually the same price and virtually just as effective.
0:34:18.380 --> 0:34:28.670
Spetelunas, Corey
So we've we've decided to go strictly sinusoidal on this particular project, which should be a a noticeable noise reduction over the conventional rumble strips.
0:34:30.880 --> 0:34:31.940
Spetelunas, Corey
And then just for comparison.
0:34:33.970 --> 0:34:41.80
Spetelunas, Corey
I know this is a pretty heavily trucked route, but Jake break is about 105 decibels.
0:34:42.470 --> 0:34:47.60
Spetelunas, Corey
I mean, you're into almost beyond a jet plane that's significant.
0:34:49.510 --> 0:34:59.710
Spetelunas, Corey
That a motorcycle could be up to 116 uh might would not be surprised if that's not a daily noise up up in that region of Route 2.
0:35:1.90 --> 0:35:6.470
Spetelunas, Corey
So I just wanted to gonna present those as as comparisons if you will.
0:35:8.710 --> 0:35:9.90
Spetelunas, Corey
Umm.
0:35:9.250 --> 0:35:10.670
Spetelunas, Corey
Here's the New Hampshire example.
0:35:11.650 --> 0:35:19.590
Spetelunas, Corey
So back in 2011 I'm some rumble strips were installed on 11 miles of New Hampshire, 16 in Wakefield.
0:35:21.580 --> 0:35:27.80
Spetelunas, Corey
This graph will we'll tricky to to the cipher, so I'm gonna kind of walk through it.
0:35:27.90 --> 0:35:27.860
Spetelunas, Corey
Piece meal a little bit.
0:35:29.430 --> 0:35:35.200
Spetelunas, Corey
Essentially, the left half of the graph that says 2002, 2010.
0:35:37.310 --> 0:35:40.160
Spetelunas, Corey
Got a pretty consistent volume of traffic.
0:35:40.710 --> 0:35:45.300
Spetelunas, Corey
These blue boxes are the ADT which stands for annual average daily traffic.
0:35:46.570 --> 0:35:53.230
Spetelunas, Corey
So on an average day, this would be how much traffic you would get from million vehicle miles traveled.
0:35:53.280 --> 0:35:53.460
Spetelunas, Corey
Sorry.
0:35:54.770 --> 0:35:55.160
Spetelunas, Corey
Umm.
0:35:55.590 --> 0:36:6.10
Spetelunas, Corey
So higher higher traffic and the amount of driving they're doing essentially and it held pretty steady through this nine year period.
0:36:7.260 --> 0:36:19.510
Spetelunas, Corey
We installed rumble strips in 2011 on the the vehicle miles traveled stayed relatively the same and as it spiked around 2018-2019.
0:36:23.440 --> 0:36:28.700
Spetelunas, Corey
And these little orange boxes down here are the crash rate per year really get into that in just a second.
0:36:28.710 --> 0:36:37.530
Spetelunas, Corey
But I just wanted to acknowledge how much the traffic went up at the end of this after rumble strips were installed.
0:36:38.570 --> 0:36:45.850
Spetelunas, Corey
I mean, we're 27 million mile vehicles traveled higher in these last two years.
0:36:45.860 --> 0:36:47.480
Spetelunas, Corey
The way our for the majority of the rest of this chart.
0:36:50.600 --> 0:37:5.630
Spetelunas, Corey
So these are the orange bars from the previous slide, just with the traffic removed because I can show you this all day, but at the end it's it's a really little orange bar at the bottom that looks almost the same across the whole axis of that grid.
0:37:7.840 --> 0:37:11.510
Spetelunas, Corey
So taking the traffic out, we'll keep that in mind.
0:37:11.780 --> 0:37:23.730
Spetelunas, Corey
But now we can look at the crash rate and he noticed the crash rate for this before rumble strip insulation period was was almost six 5.8 crashes a year from.
0:37:24.500 --> 0:37:26.640
Spetelunas, Corey
And again, this is just run off the road crashes.
0:37:27.340 --> 0:37:33.210
Spetelunas, Corey
This does not have centerlines because of, uh, crash data limitations and stuff.
0:37:37.270 --> 0:37:41.400
Spetelunas, Corey
So we spiked to, you know, 8.4 in 2005.
0:37:41.830 --> 0:37:43.80
Spetelunas, Corey
A lot of these are pretty high.
0:37:43.90 --> 0:37:52.530
Spetelunas, Corey
Had a couple of years of I'm more random, you know, successful people weren't running off the road years.
0:37:54.320 --> 0:37:59.510
Spetelunas, Corey
Brummel strip get installed in 2011 in the in the green dashed box.
0:37:59.520 --> 0:38:7.410
Spetelunas, Corey
Here then, those immediately afterwards you know 4.7 the very first year is the highest it's been.
0:38:8.870 --> 0:38:13.340
Spetelunas, Corey
And ever since that, I mean you, you go over 4 in the last two years.
0:38:15.520 --> 0:38:27.700
Spetelunas, Corey
We acknowledge the traffic is exceptionally higher and those last two years, so it makes sense that it would go up a little bit, but it's still drastically lower than the pre rumble stone condition.
0:38:29.10 --> 0:38:35.460
Spetelunas, Corey
Umm, you know, 2.6 crashes on average per year without considering sideline crashes.
0:38:36.780 --> 0:38:37.900
Spetelunas, Corey
Is is pretty significant.
0:38:42.380 --> 0:38:44.990
Spetelunas, Corey
So I did just wanna touch on specific locations.
0:38:46.130 --> 0:38:47.960
Spetelunas, Corey
There were planning on installing these.
0:38:48.90 --> 0:38:48.840
Spetelunas, Corey
This is Jefferson.
0:38:48.890 --> 0:38:57.140
Spetelunas, Corey
I don't know if anyone's from Jefferson that's in attendance tonight, but umm, primarily around uh, 115.
0:38:59.140 --> 0:39:14.130
Spetelunas, Corey
There is a current gap if you are familiar with an upcoming project between Jefferson and Randolph, there is where skipping that portion, that portion should have rumble strips installed as part of that project.
0:39:15.200 --> 0:39:20.260
Spetelunas, Corey
Which I think is a 2026 construction, but that could be delayed.
0:39:23.430 --> 0:39:36.20
Spetelunas, Corey
Getting into Randolph, there's more where we're looking here spanning I guess for identifier sake, most of the length of uh Durand Rd.
0:39:38.20 --> 0:39:43.80
Spetelunas, Corey
We can come back to this if this more questions about specifics. Umm.
0:39:43.210 --> 0:39:44.930
Spetelunas, Corey
Then show Bird and Gorham.
0:39:45.260 --> 0:39:46.280
Spetelunas, Corey
How much smaller map?
0:39:47.330 --> 0:39:49.70
Spetelunas, Corey
Because there aren't a lot more going on.
0:39:51.130 --> 0:39:52.120
Spetelunas, Corey
I should note that.
0:39:54.320 --> 0:39:57.40
Spetelunas, Corey
Because we're in Randolph here, 2A and 2B.
0:39:57.790 --> 0:40:0.670
Spetelunas, Corey
My legend are just center line.
0:40:1.630 --> 0:40:10.690
Spetelunas, Corey
Rumble strips, signing sort of rumble strips the rest of these CD halfway through I our son online and shoulder rumble strips.
0:40:15.510 --> 0:40:16.150
Spetelunas, Corey
So next steps.
0:40:17.220 --> 0:40:22.580
Spetelunas, Corey
So this project is the public outreach was a little delayed for this one.
0:40:22.590 --> 0:40:29.750
Spetelunas, Corey
I apologize, umm, the project did advertise on March 12th, which was last Tuesday.
0:40:30.770 --> 0:40:33.420
Spetelunas, Corey
Ohm, it does have a three week bid period.
0:40:33.430 --> 0:40:37.390
Spetelunas, Corey
So although that is out for bids?
0:40:37.910 --> 0:40:43.430
Spetelunas, Corey
Umm it is modifiable, so anything that happens here it's not.
0:40:43.550 --> 0:40:46.690
Spetelunas, Corey
It's not a foregone conclusion that, OK, the DOT did this.
0:40:47.290 --> 0:40:48.480
Spetelunas, Corey
This is a waste of time.
0:40:48.970 --> 0:40:50.20
Spetelunas, Corey
No, no, we can.
0:40:50.370 --> 0:40:50.880
Spetelunas, Corey
I don't.
0:40:50.890 --> 0:41:17.870
Spetelunas, Corey
We're not gonna be adding rumble strips, but if there's areas that we're concerned about rumble strips being proposed, and now that we really wanna remove after this discussion, umm or even the Shelbourne one next week if people wanna hear their spiel again and and talk in person, we'll be in Shelburne next Wednesday at their town hall at 6.
0:41:20.0 --> 0:41:24.750
Spetelunas, Corey
Between this meeting and that meeting, we can still edit the plans if we need to.
0:41:27.40 --> 0:41:30.140
Spetelunas, Corey
The plan is to construct this this spring and summer.
0:41:31.150 --> 0:41:33.80
Spetelunas, Corey
Uh, they March now.
0:41:33.90 --> 0:41:38.110
Spetelunas, Corey
It's probably late June, early July time frame.
0:41:38.910 --> 0:41:41.870
Spetelunas, Corey
Uh, they probably be eligible to start working on this.
0:41:43.100 --> 0:41:43.460
Spetelunas, Corey
Umm.
0:41:44.60 --> 0:41:51.510
Spetelunas, Corey
And then kind of a post construction step would be for us to basically does determine how effective this is.
0:41:52.360 --> 0:41:58.20
Spetelunas, Corey
We have some data that we went through during the beginning of this presentation that I'm showed what's happening today.
0:41:59.330 --> 0:42:13.120
Spetelunas, Corey
So similar to, you know, this information in Wakefield, we we'd be just as interested to see what happens, you know in the post five years or so period here.
0:42:15.700 --> 0:42:18.990
Spetelunas, Corey
Umm, that's pretty much what I got for you.
0:42:19.960 --> 0:42:21.750
Spetelunas, Corey
There's my contact information.
0:42:21.760 --> 0:42:38.130
Spetelunas, Corey
If you have any questions that come up after this as well as the QR code to the project website, this presentation as I mentioned will be umm placed on the website tomorrow.
0:42:38.180 --> 0:42:47.690
Spetelunas, Corey
I hope as well as the links to the maps and everything like that, so I'm gonna open this up to questions.
0:42:48.250 --> 0:42:48.690
Spetelunas, Corey
Comments.
0:42:48.700 --> 0:42:53.540
Spetelunas, Corey
We'll go through the chat after people are done asking with their hand up.
0:42:55.380 --> 0:43:0.610
Spetelunas, Corey
I I think a lot of people have their name on their, you know, identified already.
0:43:0.620 --> 0:43:6.820
Spetelunas, Corey
But when you ask a question, if you could just state your name and we'll we'll go from there.
0:43:7.660 --> 0:43:14.310
Spetelunas, Corey
So June I have unmuted your at least allowed you to unmute yourself if you'd like to ask a question.
0:43:17.430 --> 0:43:17.940
June Hammond Rowan
Hi Corey.
0:43:17.950 --> 0:43:19.510
June Hammond Rowan
Thank you for the presentation.
0:43:19.750 --> 0:43:19.940
Spetelunas, Corey
Hi.
0:43:20.750 --> 0:43:22.680
June Hammond Rowan
Hi I'm June Hammond.
0:43:30.150 --> 0:43:30.620
Spetelunas, Corey
Yep, Yep.
0:43:22.690 --> 0:43:37.440
June Hammond Rowan
Rowan and I just wanted to let you know that on the Randolph Planning Board, I'm chair of the Randolph Planning Board and we discussed this proposal for what we knew about it based on on the limited information.
0:43:37.450 --> 0:43:42.220
June Hammond Rowan
But I we the planning board approved a letter that we're going to send in.
0:43:44.450 --> 0:43:44.620
Spetelunas, Corey
Yep.
0:43:50.650 --> 0:43:50.820
Spetelunas, Corey
Sure.
0:43:42.290 --> 0:43:51.640
June Hammond Rowan
I'll send it in tonight or tomorrow morning to William Cass's, Commissioner, and will send it to you, if obviously, I just want to read it, if you can bear with me, just so you have the information.
0:43:51.650 --> 0:43:53.380
June Hammond Rowan
Everybody else on here has it too.
0:43:54.160 --> 0:43:54.380
Spetelunas, Corey
Sure.
0:43:53.850 --> 0:44:1.810
June Hammond Rowan
So, dear Commissioner Cass, the Randolph, New Hampshire Planning Board is aware of the New Hampshire Department of transportations plan to install rumble strips on US Route 2.
0:44:2.560 --> 0:44:6.770
June Hammond Rowan
The Planning Board discussed this proposal at their meeting on March 7th, 2024.
0:44:6.880 --> 0:44:13.20
June Hammond Rowan
While we acknowledge that rumble strips may be effective in reducing roadway departure crashes, we offer the following comments.
0:44:13.620 --> 0:44:16.210
June Hammond Rowan
Number one, noise impacts from rumble strips.
0:44:16.350 --> 0:44:28.10
June Hammond Rowan
The Planning Board is concerned about noise impacts from rumble strips on Route 2 in Randolph at the December 3rd, 2020 online net New Hampshire DOT Public Information meeting about the proposal.
0:44:28.110 --> 0:44:36.670
June Hammond Rowan
A number of property owners expressed concern about the current noise from USB two and also future noise generated by vehicles traveling over rumble strips.
0:44:37.60 --> 0:44:45.310
June Hammond Rowan
The Randolph Valley is surrounded by steep slopes, sound from Route 2 carries up slope and can be heard far away on both sides of the valley, even through wooded areas.
0:44:45.780 --> 0:44:50.470
June Hammond Rowan
Property owners in Randolph have noted noise impacts from US Route 2 for years.
0:44:50.880 --> 0:45:0.670
June Hammond Rowan
In fact, the 2001 US Route 2 Corridor study, completed by VHP engineers, documented that many residents expressed concern about noise over 20 years later.
0:45:0.680 --> 0:45:1.650
June Hammond Rowan
This remains a concern.
0:45:2.430 --> 0:45:13.650
June Hammond Rowan
The Planning Board is aware that noise impacts have led DOT to remove rumble strips in several location in New Hampshire, and we hope this will be an option if rumble strips are installed and property owners are adversely impacted.
0:45:14.530 --> 0:45:21.240
June Hammond Rowan
#2 bicycle safety the Planning Board hopes that HOT will consider bicycles and planning for rumble strips on US Route 2.
0:45:21.710 --> 0:45:31.420
June Hammond Rowan
Cyclists often ride on the shoulders of US Route 2 and rumble strips can be dangerous in areas where the shoulder is narrow and or there is guardrail #3 passing zones.
0:45:31.510 --> 0:45:34.820
June Hammond Rowan
Rumble strips and passing zones create noise from passing maneuvers.
0:45:35.310 --> 0:45:46.820
June Hammond Rowan
The Planning board asks NHD OT to consider reducing the amount of passing zones on US route 2IN Randolph to both enhance safety, which is really the goal and minimize noise impacts.
0:45:46.830 --> 0:45:53.780
June Hammond Rowan
Specifically, we ask and HOT to remove the passing zones along US Route 2 at and near Appalachia parking lot.
0:45:54.170 --> 0:46:3.260
June Hammond Rowan
Appalachia parking lot is often full and vehicles parked on the shoulder and or gravel areas along the South side of Route 2 for at least a half a mile to both the east and West.
0:46:3.750 --> 0:46:16.100
June Hammond Rowan
It is dangerous to pull out on, pull on into, or out of Appalachia parking area when site distance is limited due to cars lined up along US Route 2 allowing passing in this area only adds to the hazard.
0:46:17.410 --> 0:46:27.720
June Hammond Rowan
The US Federal Highway Administration states quote the best rumble strip, application design and placement on one roadway may not fit the context of another roadway.
0:46:28.70 --> 0:46:35.920
June Hammond Rowan
The Randolph Planning Board asks and HOT to carefully consider the specific context of our community when finalizing Rumble Strip plans.
0:46:36.290 --> 0:46:38.730
June Hammond Rowan
Sincerely, the Randolph, New Hampshire Planning Board.
0:46:39.70 --> 0:46:39.440
June Hammond Rowan
Thank you.
0:46:42.140 --> 0:46:43.170
Spetelunas, Corey
No, I appreciate that.
0:46:43.180 --> 0:46:43.750
Spetelunas, Corey
Thank you.
0:46:44.600 --> 0:46:48.310
Spetelunas, Corey
And I we spoke on the phone recently about this 2020 meeting that happened.
0:46:48.940 --> 0:46:58.220
Spetelunas, Corey
I did find a few comments from that which I it it sounds similar to the the concerns that that letter will express.
0:47:0.390 --> 0:47:10.760
Spetelunas, Corey
I I do hope that the bicycle concern is is less umm, that's what I tell you and the details, not how fantastic.
0:47:10.770 --> 0:47:12.190
Spetelunas, Corey
So it's hiding in the back here.
0:47:13.280 --> 0:47:18.680
Spetelunas, Corey
I'm just noting kind of the the typical layout of our rumble strips to accommodate for bicycles.
0:47:19.510 --> 0:47:19.970
Spetelunas, Corey
Umm.
0:47:20.390 --> 0:47:27.310
Spetelunas, Corey
This kind of in conjunction with the umm the width requirement of the shoulder of 6 feet.
0:47:28.340 --> 0:47:28.720
Spetelunas, Corey
Umm.
0:47:29.80 --> 0:47:37.90
Spetelunas, Corey
So if if we were to do the math here, umm, go to but everyone's eyes flipping through these slides.
0:47:45.940 --> 0:47:46.190
Spetelunas, Corey
Umm.
0:47:47.740 --> 0:47:58.680
Spetelunas, Corey
So the distance from for for bicyclists in particular here on the distance from the white line to the edge of this rumble strip is 1 foot the width of the rumble strip is another foot.
0:47:59.520 --> 0:48:16.10
Spetelunas, Corey
So by having that 6 foot requirement from Edge line to edge of pavement, I'm still gives bicyclists 4 feet, or in the case of guardrail 5 feet, because that that requirement was up umm to 7 feet total.
0:48:16.340 --> 0:48:17.820
Spetelunas, Corey
So they'll still have 4 feet.
0:48:18.670 --> 0:48:27.560
Spetelunas, Corey
We'll have 5 feet in front of guardrail, but there's something called shy distance that you don't wanna ride too close to the guardrail because you might snag your pedal or hand the bar or something.
0:48:27.570 --> 0:48:30.330
Spetelunas, Corey
And we don't wanna have people wipe out and fall into the road.
0:48:31.450 --> 0:48:35.840
Spetelunas, Corey
Umm and the the minimum acceptable width for a bicycle of per.
0:48:36.190 --> 0:48:45.470
Spetelunas, Corey
I think it's hostile to the federal some guidance agency is is a four foot shoulder for bicyclist bicyclists.
0:48:45.800 --> 0:48:46.560
Spetelunas, Corey
So so that.
0:48:48.800 --> 0:48:56.200
Spetelunas, Corey
Umm, that distance is the width available for bikes is is maintained if the shoulder is less than six feet.
0:48:57.20 --> 0:49:20.470
Spetelunas, Corey
We're not putting rumble strips in, so no concern about the narrow shoulders to me, if if that does happen and before these actually physically get installed, I I would presume I would be one of the people to go out there to actually approve the layout before they actually start mailing out the payment of to do this work.
0:49:24.550 --> 0:49:30.10
Spetelunas, Corey
The noise is, but yeah, rumble strips are are going to generate noise.
0:49:30.580 --> 0:49:36.140
Spetelunas, Corey
That's that's half of their function is that, you know, vibrate, vibrate the car and and make noise.
0:49:37.740 --> 0:49:50.930
Spetelunas, Corey
These sinusoidal ones like we went through will make less noise if if you're sharing the roadway now from your house, you're you're going to hear the rumble strips.
0:49:53.510 --> 0:50:6.80
Spetelunas, Corey
I I think the the view I want to try to impart is that the IT it shouldn't be viewed as a a nuisance noise and I know that's difficult.
0:50:6.700 --> 0:50:7.80
Spetelunas, Corey
Umm.
0:50:7.890 --> 0:50:12.990
Spetelunas, Corey
Because if if somebody's hitting it and hearing that noise it it's because somebody left their lane.
0:50:14.940 --> 0:50:23.60
Spetelunas, Corey
I mean, the alternative is that they're not there and and I'm sure the majority of people self correct, you know pretty quickly.
0:50:23.960 --> 0:50:34.190
Spetelunas, Corey
Umm, but that one person that doesn't is going to hit somebody head on and cause a lot of damage or or go off the road and it's.
0:50:35.560 --> 0:50:38.630
Spetelunas, Corey
But it's kind of been coined as the sound of safety.
0:50:39.380 --> 0:50:43.750
Spetelunas, Corey
Not that that what's a better spin on it for people to have to listen to it on the regular?
0:50:44.700 --> 0:50:49.10
Spetelunas, Corey
Umm, but just it's it's a, that's it.
0:50:49.80 --> 0:50:57.270
Spetelunas, Corey
You know, we mentioned it's it's safety essentially we're trying to keep people on the road and getting to their destination safely.
0:50:59.60 --> 0:51:4.500
Spetelunas, Corey
The passing zone, especially at Appalachian, I I did talk to a few people around here about this.
0:51:5.550 --> 0:51:6.0
Spetelunas, Corey
Umm.
0:51:7.310 --> 0:51:17.40
Spetelunas, Corey
The passing zone I think would be difficult to justify the removal of only because that portion is so.
0:51:19.720 --> 0:51:20.170
Spetelunas, Corey
Open.
0:51:20.300 --> 0:51:32.760
Spetelunas, Corey
I guess it's it's determined by the the site distance based on the speed and there's this plenty of open space there for the vehicles on the roadway.
0:51:34.80 --> 0:51:34.630
Spetelunas, Corey
Uh.
0:51:34.670 --> 0:51:38.330
Spetelunas, Corey
If if Appalachian wasn't there, I I don't see that being.
0:51:38.340 --> 0:51:42.500
Spetelunas, Corey
You're concerned that being said Appalachia is there?
0:51:43.600 --> 0:51:56.810
Spetelunas, Corey
Umm and I I do recognize even from a Google Street View or a Google aerial that there is and strong parking movement.
0:51:56.820 --> 0:52:1.580
Spetelunas, Corey
I guess if you will that parking lot is always false, so vehicle spill over to the the shoulder.
0:52:3.0 --> 0:52:9.900
Spetelunas, Corey
Umm so I don't know if that becomes the like an enforcement issue.
0:52:9.910 --> 0:52:10.310
Spetelunas, Corey
I don't know.
0:52:10.320 --> 0:52:12.620
Spetelunas, Corey
Parking is prohibited on that portion of Route 2.
0:52:13.770 --> 0:52:16.730
Spetelunas, Corey
I don't know if more parking needs to be created.
0:52:18.400 --> 0:52:20.310
Spetelunas, Corey
Umm, but I'm.
0:52:20.320 --> 0:52:21.270
Spetelunas, Corey
I'm not gonna say no.
0:52:21.280 --> 0:52:28.820
Spetelunas, Corey
We can certainly look into it some more and have that that follow up, but there might be might be some other.
0:52:30.370 --> 0:52:36.840
Spetelunas, Corey
But improvements that can be made to to help address people parking on the road?
0:52:37.180 --> 0:53:1.540
Spetelunas, Corey
I guess umm, but as you mentioned Bill Kass, Commissioner DOT will will get that letter and I did notice that that particular concern was noted back in 2020 and we can certainly discussed that further and it'll happen before this project hits the road and we'll have plenty of time to to make any changes if if it goes that way.
0:53:1.550 --> 0:53:8.730
Spetelunas, Corey
You can certainly involve you and all those discussions, umm, as the one that's I apologize.
0:53:10.80 --> 0:53:11.140
Spetelunas, Corey
Umm Paul.
0:53:11.180 --> 0:53:12.630
Spetelunas, Corey
It's like a Jordan next.
0:53:13.0 --> 0:53:15.690
Spetelunas, Corey
Your Mike is it will be turned on.
0:53:25.400 --> 0:53:26.10
Zatecka, AmandaJoe
Corey, sorry.
0:53:26.20 --> 0:53:26.790
Zatecka, AmandaJoe
This is Amanda.
0:53:26.800 --> 0:53:29.600
Zatecka, AmandaJoe
Just so you know, there's also some questions in the chat.
0:53:30.500 --> 0:53:33.720
Spetelunas, Corey
Yep, I'll double back to those in just a moment.
0:53:36.380 --> 0:53:36.610
Spetelunas, Corey
All.
0:53:36.620 --> 0:53:41.30
Spetelunas, Corey
Did you movie question you wanted to turn your mic on to ask?
0:53:47.310 --> 0:53:48.770
Spetelunas, Corey
Or you could type it in the chat anyway.
0:53:50.490 --> 0:53:51.330
Spetelunas, Corey
If you like start working.
0:53:56.750 --> 0:53:58.40
Spetelunas, Corey
They backtrack a little.
0:53:58.330 --> 0:54:0.120
Spetelunas, Corey
Look at some chat questions here.
0:54:0.130 --> 0:54:2.660
Spetelunas, Corey
In the meantime, uh, OK.
0:54:2.670 --> 0:54:3.480
Spetelunas, Corey
So Lori asked.
0:54:3.490 --> 0:54:4.660
Spetelunas, Corey
It's also very dark at night.
0:54:4.670 --> 0:54:9.190
Spetelunas, Corey
Along route 2IN, Randolph has lights or additional reflectors been considered as well.
0:54:10.670 --> 0:54:12.590
Spetelunas, Corey
Lights. No.
0:54:14.970 --> 0:54:22.590
Spetelunas, Corey
Only because there was there was an effort several years ago to actually, umm, contradictory enough remove lights.
0:54:22.760 --> 0:54:29.810
Spetelunas, Corey
That's they weren't that, umm, specific locations like intersections or pedestrian crossings or such.
0:54:30.840 --> 0:54:36.270
Spetelunas, Corey
So I can't imagine it's putting bites on Route 2 for this purpose.
0:54:37.80 --> 0:54:37.630
Spetelunas, Corey
Uh, hum.
0:54:37.710 --> 0:54:41.110
Spetelunas, Corey
But reflectors, and although they aren't included in this project.
0:54:42.580 --> 0:54:43.750
Spetelunas, Corey
Umm could be used.
0:54:43.760 --> 0:54:54.300
Spetelunas, Corey
We've we've looked at larger delineators, which are the kind of roadside posts with the little 2 by 4 yellow.
0:54:54.700 --> 0:55:9.60
Spetelunas, Corey
Well, maybe white in this case, white reflector placard thing that you'll and at night you'll you'll have the headlights bounce off that and kind of I'm doing it.
0:55:10.110 --> 0:55:19.520
Spetelunas, Corey
Hoping that the edge of the road we looked at putting larger versions of those out to to help and and those are pretty effective too.
0:55:20.70 --> 0:55:32.70
Spetelunas, Corey
Not to the degree of rumble strips, but that's that's certainly something that could be looked at in in addition to or especially where the road doesn't qualify for rumble strips.
0:55:35.40 --> 0:55:40.830
Spetelunas, Corey
Current asked if we have an estimate for reduction of crashes and fatalities, and Randolph informal steps are installed.
0:55:41.280 --> 0:55:52.220
Spetelunas, Corey
I have not done the math that highway safety manual umm noted earlier, and we could look at that and see what that is.
0:55:52.230 --> 0:55:55.140
Spetelunas, Corey
That would be an interesting observation.
0:55:55.150 --> 0:55:57.50
Spetelunas, Corey
I would expect to be pretty similar.
0:55:58.160 --> 0:55:58.930
Spetelunas, Corey
We also have the.
0:56:1.0 --> 0:56:2.130
Spetelunas, Corey
Passing my let me keyboard.
0:56:6.430 --> 0:56:21.850
Spetelunas, Corey
The crash reduction factors here that I mentioned, so I would I would expect that a lot of those numbers would reflect, you know about a 50% reduction in head on crashes, which again were not in that crash information that we looked at earlier.
0:56:23.980 --> 0:56:28.450
Spetelunas, Corey
But it would be more applicable even if we took an average of, say, 30% or so.
0:56:32.370 --> 0:56:33.120
Zatecka, AmandaJoe
So carried.
0:56:28.640 --> 0:56:33.610
Spetelunas, Corey
That would expect those numbers to go down about 30%, but I could, yeah.
0:56:36.600 --> 0:56:36.860
Spetelunas, Corey
Who?
0:56:34.290 --> 0:56:40.480
Zatecka, AmandaJoe
Sorry, I did some quick math on the Wakefield data that you showed the foreign after.
0:56:39.80 --> 0:56:41.140
Spetelunas, Corey
Uh-huh. Yeah.
0:56:41.170 --> 0:56:43.860
Zatecka, AmandaJoe
So it looks like they're reduction there was 45%.
0:56:45.0 --> 0:56:45.280
Spetelunas, Corey
OK.
0:56:47.760 --> 0:56:53.880
Zatecka, AmandaJoe
So that would be your 2nd 13 to 4051% single vehicle roadway departure.
0:56:53.820 --> 0:57:5.810
Spetelunas, Corey
But beyond the highland and with Randolph having such a high percentage of their crashes being a run off the road, I could I could see that being on the higher end of this this range.
0:57:8.160 --> 0:57:10.950
Spetelunas, Corey
I'm still pausing on the yeah.
0:57:15.160 --> 0:57:18.780
Spetelunas, Corey
Mark, how did the mumble strips affect snow plow and driving?
0:57:18.790 --> 0:57:22.240
Spetelunas, Corey
And inclement weather, in short, they they shun it.
0:57:23.410 --> 0:57:26.820
Spetelunas, Corey
The plows the the so rumble strips.
0:57:26.830 --> 0:57:38.340
Spetelunas, Corey
Conventional ones are kind of, you know, the slide are, uh, fully recessed, mild in snow, piles of black right over the top.
0:57:38.900 --> 0:57:41.910
Spetelunas, Corey
The Sinusoidal's are also fully recessed.
0:57:43.160 --> 0:57:50.620
Spetelunas, Corey
Even those top parts of the leave that this level of sitting on are actually recessed.
0:57:51.170 --> 0:57:52.550
Spetelunas, Corey
Just the smallest little bit.
0:57:54.810 --> 0:58:1.760
Spetelunas, Corey
Which kind of reinforces the pavement marking longevity that we're hoping to achieve a little bit.
0:58:2.540 --> 0:58:2.750
Spetelunas, Corey
Umm.
0:58:2.760 --> 0:58:7.310
Spetelunas, Corey
As well as adding some of that extra visibility because they they aren't being scraped up by the blouse.
0:58:9.670 --> 0:58:10.710
Spetelunas, Corey
There really hasn't been any.
0:58:12.750 --> 0:58:21.280
Spetelunas, Corey
Any solid indication that these get like hidden under snow or or rain gets stuck in them.
0:58:21.350 --> 0:58:28.10
Spetelunas, Corey
You know the water, so the visibility should be you know just like a normal normal paper marking.
0:58:28.910 --> 0:58:32.950
Spetelunas, Corey
Umm so that that might kind of address your inclement weather there.
0:58:32.960 --> 0:58:40.190
Spetelunas, Corey
There'll be, admittedly there'd be a little bit harder to feel in like a a heavy of snow.
0:58:41.200 --> 0:58:42.510
Spetelunas, Corey
You know that dumb snow?
0:58:42.560 --> 0:58:42.900
Spetelunas, Corey
Kind of deal.
0:58:44.860 --> 0:58:46.330
Spetelunas, Corey
But so would normal rumble strips.
0:58:46.780 --> 0:58:49.190
Spetelunas, Corey
I've I've driven on 202.
0:58:49.200 --> 0:58:56.250
Spetelunas, Corey
I used to commute on 202 back and forth to work and the rumble strips were essentially how I knew where my lane was.
0:58:57.420 --> 0:59:1.860
Spetelunas, Corey
So this would be fairly similar manager or something.
0:59:1.870 --> 0:59:2.750
Spetelunas, Corey
Now to add in there.
0:59:4.630 --> 0:59:5.20
Zatecka, AmandaJoe
I didn't.
0:59:7.220 --> 0:59:7.420
Spetelunas, Corey
OK.
0:59:5.30 --> 0:59:14.290
Zatecka, AmandaJoe
You just covered it with 202, so I I've had similar experiences having to commute on 28 every day with sinusoidal rumble strips.
0:59:17.340 --> 0:59:20.370
Spetelunas, Corey
So June asked about the NEPA review for this.
0:59:21.500 --> 0:59:29.510
Spetelunas, Corey
So this was originally part of, which is why some other DOT representatives were here in 2020.
0:59:29.600 --> 0:59:47.390
Spetelunas, Corey
Originally part of a another project that was installing rumble strips on 106 umm, so the NEPA process for anyone unfamiliar, that's the basically environmental process we have to go through to, you know, make sure we're not negatively impacting anything with our projects.
0:59:49.470 --> 0:59:51.520
Spetelunas, Corey
So this this project was looked at for.
0:59:53.700 --> 0:59:54.360
Spetelunas, Corey
I mean a lot.
0:59:54.370 --> 1:0:1.170
Spetelunas, Corey
Most of our work is within the pavement, so it was it was a pretty minimal effort, but making sure there were no sensitive areas or.
1:0:4.550 --> 1:0:5.980
Spetelunas, Corey
Sensitive creatures.
1:0:7.750 --> 1:0:16.180
Spetelunas, Corey
Stuff like that, that that would be impacted any cultural or historic, umm, sites, anything like that.
1:0:16.190 --> 1:0:21.840
Spetelunas, Corey
So that was I'm, I know environmental guru or expert by any stretch.
1:0:22.640 --> 1:0:23.10
Spetelunas, Corey
Umm.
1:0:24.40 --> 1:0:30.490
Spetelunas, Corey
If you want a better answer than that, I can gladly reach out to someone that can explain it better than I just did.
1:0:31.280 --> 1:0:39.0
Spetelunas, Corey
Umm, but the NEPA process was completed for this project and I can get you more information for that if if you'd like June.
1:0:41.110 --> 1:0:45.530
Spetelunas, Corey
Ohm project doesn't actually thought about that and.
1:0:48.10 --> 1:0:50.290
Spetelunas, Corey
Do you remember what this estimate is?
1:0:50.300 --> 1:0:52.370
Spetelunas, Corey
I've stopped your head, Amanda.
1:0:54.930 --> 1:0:58.50
Zatecka, AmandaJoe
I don't have it right in front of me, unfortunately.
1:0:57.460 --> 1:0:59.960
Spetelunas, Corey
They can get that for you with just one second.
1:1:2.180 --> 1:1:2.360
Spetelunas, Corey
Maybe.
1:1:10.950 --> 1:1:19.880
Zatecka, AmandaJoe
I was actually able to look up the crash reduction estimates for a stalling think additional delineators.
1:1:20.340 --> 1:1:20.570
Spetelunas, Corey
Umm.
1:1:19.890 --> 1:1:24.890
Zatecka, AmandaJoe
Of course, this is for a world that already didn't have one, and the crash reductions up 15%.
1:1:26.710 --> 1:1:28.140
Spetelunas, Corey
15 or 50.
1:1:25.860 --> 1:1:28.190
Zatecka, AmandaJoe
So I think rumble strip?
1:1:28.230 --> 1:1:31.760
Zatecka, AmandaJoe
Yes, rumble strips would put us at more or equal to that.
1:1:33.660 --> 1:1:34.30
Spetelunas, Corey
Right.
1:1:34.40 --> 1:1:34.360
Spetelunas, Corey
So.
1:1:34.410 --> 1:1:36.270
Spetelunas, Corey
So it's kind of a good point.
1:1:37.100 --> 1:1:40.700
Spetelunas, Corey
The crash reduction fact is that we were looking at aren't necessarily.
1:1:43.40 --> 1:1:43.510
Spetelunas, Corey
Additive.
1:1:44.790 --> 1:1:54.660
Spetelunas, Corey
So it's not like, you know, say you get 50% reduction from your head on crashes, then you add extra delineator posts that have the large placard on it.
1:1:55.150 --> 1:1:57.100
Spetelunas, Corey
You you don't get another 50%.
1:1:57.490 --> 1:2:0.0
Spetelunas, Corey
You know, it doesn't guarantee you no one's gonna run off the road, ever.
1:2:0.950 --> 1:2:6.640
Spetelunas, Corey
It's going to be better, but it's it's by no stretch of the imagination additive.
1:2:11.240 --> 1:2:17.340
Spetelunas, Corey
Do you have so this project right now June is about $350,000?
1:2:17.700 --> 1:2:18.220
Spetelunas, Corey
Estimated.
1:2:19.30 --> 1:2:23.910
Spetelunas, Corey
Umm, that's going to the the final price will depend on what the contractor comes back with.
1:2:25.580 --> 1:2:30.730
Spetelunas, Corey
Hopefully no one on here is a contractor and exploited me for that information, but I'm gonna.
1:2:30.740 --> 1:2:32.40
Spetelunas, Corey
I'm gonna trust you on that one.
1:2:35.80 --> 1:2:36.800
Spetelunas, Corey
Barbara and Bell's first responders.
1:2:36.810 --> 1:2:39.470
Spetelunas, Corey
We applied the insertion of rumble strips, the vast majority of accidents.
1:2:39.480 --> 1:2:43.490
Spetelunas, Corey
We have sprung it to both fatal and non fatal may have been prevented by the rebel strips.
1:2:43.860 --> 1:2:45.850
Spetelunas, Corey
This includes the motorcycle accident five years ago.
1:2:46.780 --> 1:2:49.550
Spetelunas, Corey
Wow, that's actually an excellent point, Bill.
1:2:49.560 --> 1:2:50.430
Spetelunas, Corey
And Barbara, thank you.
1:2:50.440 --> 1:2:53.850
Spetelunas, Corey
I I'm sure the wrong thing for my presentation.
1:2:55.330 --> 1:3:15.130
Spetelunas, Corey
I did actually want to mention that one and I don't have right now for that, but like that might have been off my screen a little bit, but that that incident that took out all those motorcycles and towards the Jefferson Randolph town line outside that motel near Valley Rd.
1:3:16.310 --> 1:3:22.210
Spetelunas, Corey
Umm, several years ago, you know, was a centerline crossover, those fatalities.
1:3:22.220 --> 1:3:27.570
Spetelunas, Corey
And uh, those aren't captured in the information that we showed you earlier.
1:3:27.660 --> 1:3:36.510
Spetelunas, Corey
So you know that's I think what's seven people I believe died on that due to one person crossing the road.
1:3:37.270 --> 1:3:40.370
Spetelunas, Corey
Umm would rumbles just about?
1:3:40.500 --> 1:3:41.990
Spetelunas, Corey
Yeah, I I like to think hope so.
1:3:42.700 --> 1:3:49.890
Spetelunas, Corey
But there's also the knowledgement that you know, rumble strips aren't, umm, they're not gonna solve everything.
1:3:50.670 --> 1:4:3.130
Spetelunas, Corey
You know, if you're, uh, impaired and you know to beyond a certain degree you have medical event, you know, mechanical failure, type stuff.
1:4:5.0 --> 1:4:10.290
Spetelunas, Corey
It's not gonna matter what's in the way, but the rumble strips will help.
1:4:10.300 --> 1:4:12.790
Spetelunas, Corey
For for everything else you know you're drowsy.
1:4:13.190 --> 1:4:14.750
Spetelunas, Corey
It's it's gonna wake you up a little bit.
1:4:15.360 --> 1:4:17.390
Spetelunas, Corey
You're helping your kid in the back seat.
1:4:17.920 --> 1:4:18.990
Spetelunas, Corey
Ohh, I'm leaving my lane.
1:4:19.0 --> 1:4:21.820
Spetelunas, Corey
I need to stop this and two hands back on the wheel.
1:4:22.830 --> 1:4:28.840
Spetelunas, Corey
Umm yeah, those those are the the distractions that we can correct with the rumble strips.
1:4:30.670 --> 1:4:35.160
Spetelunas, Corey
Umm, so in the side, many of the Jake breaks have modified exhaust.
1:4:36.520 --> 1:4:37.870
Spetelunas, Corey
I'm assuming that those.
1:4:39.430 --> 1:4:40.600
Spetelunas, Corey
I'm guessing are illegal.
1:4:40.610 --> 1:4:42.0
Spetelunas, Corey
I honestly don't know either way.
1:4:42.770 --> 1:4:45.710
Spetelunas, Corey
Umm but yeah, that would definitely be an enforcement issue.
1:4:48.80 --> 1:4:52.200
Spetelunas, Corey
Please describe introduces the design process for this project and the engineering visits in the area.
1:4:53.410 --> 1:4:58.630
Spetelunas, Corey
Amanda, do you want to kind of step through how you determine the locations for the rumble strips?
1:5:0.840 --> 1:5:1.440
Spetelunas, Corey
For this project.
1:5:8.890 --> 1:5:9.70
Spetelunas, Corey
Just.
1:5:7.450 --> 1:5:11.940
Zatecka, AmandaJoe
So we basically do a review of our.
1:5:15.880 --> 1:5:21.900
Zatecka, AmandaJoe
It's called a van Data collection and we also do visit the site.
1:5:22.900 --> 1:5:31.230
Zatecka, AmandaJoe
Umm to confirm things so for rumble strip insulation we are removing major driveways.
1:5:31.740 --> 1:5:35.380
Zatecka, AmandaJoe
Intersection bridges areas that our.
1:5:38.510 --> 1:5:40.160
Zatecka, AmandaJoe
Less than 40 mph.
1:5:43.610 --> 1:5:46.910
Zatecka, AmandaJoe
And the roadway width is 28 feet or less.
1:5:47.430 --> 1:5:47.840
Zatecka, AmandaJoe
Umm.
1:5:48.310 --> 1:5:57.620
Zatecka, AmandaJoe
And in developing and finding these eligible areas, so we tended to be more conservative in the approach.
1:5:57.630 --> 1:6:5.320
Zatecka, AmandaJoe
And what I mean by this is, if we had an area that qualified for rumble strips, umm, and we weren't sure.
1:6:5.330 --> 1:6:13.700
Zatecka, AmandaJoe
So in some of the areas, some of the shoulders are one side of the shoulder, like the left shoulder, maybe 6 feet, but the other shoulder may be 4 feet.
1:6:13.710 --> 1:6:16.80
Zatecka, AmandaJoe
So in those areas, we're pretty conservative.
1:6:16.90 --> 1:6:24.990
Zatecka, AmandaJoe
We left out shoulder rumbles completely in those areas because we wanted to make sure again that we're providing for bicycles.
1:6:25.900 --> 1:6:35.670
Zatecka, AmandaJoe
Umm, so we're also going to go out in the field and confirm the roadway W when we do the installation for driveways and intersections.
1:6:35.680 --> 1:6:50.230
Zatecka, AmandaJoe
We also take a look at exactly where uh vehicles are turning out to turn and we will leave those areas out so they won't have center line or shoulder rumble strips installed.
1:6:50.750 --> 1:6:52.160
Zatecka, AmandaJoe
So that's basically our process.
1:6:56.970 --> 1:6:58.200
Spetelunas, Corey
We did.
1:6:58.510 --> 1:6:58.840
Spetelunas, Corey
June.
1:6:58.850 --> 1:6:59.860
Spetelunas, Corey
Just gonna follow up on that.
1:7:1.770 --> 1:7:5.180
Spetelunas, Corey
Amanda and I were relatively new to this project.
1:7:5.670 --> 1:7:10.820
Spetelunas, Corey
We specifically did not visit route to for the Rumble Strip.
1:7:12.160 --> 1:7:13.250
Spetelunas, Corey
He might have amended you.
1:7:13.260 --> 1:7:13.470
Spetelunas, Corey
Go.
1:7:13.520 --> 1:7:15.870
Spetelunas, Corey
Maybe I I did not.
1:7:16.230 --> 1:7:16.980
Zatecka, AmandaJoe
I have been to.
1:7:17.70 --> 1:7:18.530
Zatecka, AmandaJoe
I have been to visit US two, yes.
1:7:19.10 --> 1:7:20.660
Spetelunas, Corey
OK so I'm end has been up there.
1:7:21.290 --> 1:7:22.700
Spetelunas, Corey
I've been up on Route 2.
1:7:24.200 --> 1:7:34.400
Spetelunas, Corey
This many years ago, four or five years ago, at this point, for the replacement of the majority of the guardrail on Route 2, I was the lead project designer for that one.
1:7:35.570 --> 1:7:37.90
Spetelunas, Corey
So hold your tomatoes.
1:7:37.100 --> 1:7:37.770
Spetelunas, Corey
Please don't throw them.
1:7:38.580 --> 1:7:42.680
Spetelunas, Corey
Umm so I'm I'm very familiar with Ritu.
1:7:42.800 --> 1:7:49.250
Spetelunas, Corey
I'm standing on the side of the road and trucks whizzing by in your half, flying off your head, which is terrifying.
1:7:50.730 --> 1:7:55.200
Spetelunas, Corey
So I'm I'm familiar with Rutu was I looking at it in the context of rumble strips?
1:7:55.210 --> 1:7:57.800
Spetelunas, Corey
At the time, no, I will not tell you.
1:7:57.810 --> 1:7:58.780
Spetelunas, Corey
I was because I wasn't.
1:7:59.850 --> 1:8:7.910
Spetelunas, Corey
But we we are familiar with me too in, in that regard, can we remove rumble strips with two entrances to Durand Rd?
1:8:8.140 --> 1:8:9.790
Spetelunas, Corey
Up probably.
1:8:10.0 --> 1:8:11.210
Spetelunas, Corey
I don't recall it.
1:8:14.900 --> 1:8:15.510
Spetelunas, Corey
That'd be my guess.
1:8:10.450 --> 1:8:23.250
Zatecka, AmandaJoe
I think June is she might be referring to the interceptions and if it's an intercept one then that wouldn't be included in installation and that might not be visible from the map.
1:8:22.950 --> 1:8:24.270
Spetelunas, Corey
Yeah, I think there is a.
1:8:23.340 --> 1:8:25.560
Zatecka, AmandaJoe
That's kind of a difficult scale.
1:8:26.720 --> 1:8:49.420
Spetelunas, Corey
I think there is a break and then that would be something that we would look at more in the field when we go out to lay them out, if we notice something like that and the plans happen to go right through it with no break, we would we would add a break so that there wasn't that that's in the incidental rumble strip run overs I guess and and creating noise that that doesn't need to be there.
1:8:49.470 --> 1:8:50.70
Spetelunas, Corey
It's not.
1:8:50.260 --> 1:8:56.160
Spetelunas, Corey
It's not life saving noise, it's just that's that's the nuisance noise that we don't wanna perpetuate.
1:8:57.900 --> 1:8:58.180
Zatecka, AmandaJoe
Correct.
1:8:57.900 --> 1:8:58.770
Spetelunas, Corey
Uh, mark.
1:8:58.840 --> 1:9:3.220
Spetelunas, Corey
Noted in Appalachia has two plus spots in addition to all the pilots with cars.
1:9:4.920 --> 1:9:6.310
Spetelunas, Corey
When did this count as a space?
1:9:6.560 --> 1:9:21.0
Spetelunas, Corey
So we actually did look at that real quick mark and it it may, it may turn out where, Umm, Appalachia might not get rumble strips in the immediate area of the driveways, entrances, bullets.
1:9:21.10 --> 1:9:25.830
Spetelunas, Corey
What everyone call him, so that that's something we'd have to look at when we go out there.
1:9:25.960 --> 1:9:31.960
Spetelunas, Corey
But I I could absolutely see that that stretch of however many 100 feet it is getting getting pulled out.
1:9:32.800 --> 1:9:35.150
Zatecka, AmandaJoe
I think definitely for shoulder rumble strips.
1:9:35.160 --> 1:9:37.700
Zatecka, AmandaJoe
If they're proposed there, we would look at pulling them out.
1:9:39.310 --> 1:9:44.0
Spetelunas, Corey
Yeah, shoulder would be more competent in center line.
1:9:44.10 --> 1:9:44.340
Spetelunas, Corey
I could go.
1:9:46.250 --> 1:9:51.280
Spetelunas, Corey
Yeah, we'd have to visit again and and see what's happening again.
1:9:51.290 --> 1:9:51.540
Spetelunas, Corey
You're.
1:9:51.550 --> 1:9:53.60
Spetelunas, Corey
Yeah, but plays into that.
1:9:53.110 --> 1:9:55.650
Spetelunas, Corey
So I appreciate it. Umm.
1:9:55.510 --> 1:10:8.680
Zatecka, AmandaJoe
I would say in addition to I forgot to bring this up, but then addition to visiting the site, these are areas in Randolph and Jefferson especially, and Shelburne that just got paid the recently.
1:10:8.790 --> 1:10:12.240
Zatecka, AmandaJoe
So we work hand in hand with our.
1:10:13.670 --> 1:10:22.870
Zatecka, AmandaJoe
Pavement design section and they actually had really good data of roadway with his shoulder was from that area because those projects were just completed.
1:10:23.890 --> 1:10:27.330
Zatecka, AmandaJoe
So we also touched base with them to confirm our numbers.
1:10:31.150 --> 1:10:31.660
Spetelunas, Corey
Thanks, Amanda.
1:10:35.290 --> 1:10:38.390
Spetelunas, Corey
I think we went through all of the chat comments.
1:10:41.100 --> 1:10:41.810
Spetelunas, Corey
Paul, did you have?
1:10:41.820 --> 1:10:46.490
Spetelunas, Corey
I don't think I saw your question in chat, but your hand is hanging out up there.
1:10:46.500 --> 1:10:50.580
Spetelunas, Corey
I don't know if you had a question that we could talk about.
1:10:50.590 --> 1:10:50.770
Spetelunas, Corey
What?
1:10:50.780 --> 1:10:54.930
Spetelunas, Corey
We're still on the call, so I messed up and so.
1:11:2.120 --> 1:11:4.990
Spetelunas, Corey
Uh, so probably not, but that.
1:11:7.930 --> 1:11:9.170
Spetelunas, Corey
So there is.
1:11:11.330 --> 1:11:14.800
Spetelunas, Corey
No more questions for this particular meeting.
1:11:15.790 --> 1:11:19.640
Spetelunas, Corey
Umm, I'll put my contact info back up here.
1:11:20.610 --> 1:11:21.40
Spetelunas, Corey
It's not.
1:11:21.50 --> 1:11:24.390
Spetelunas, Corey
I think everyone for coming out, coming out.
1:11:24.510 --> 1:11:26.470
Spetelunas, Corey
Yeah, attending.
1:11:26.560 --> 1:11:28.260
Spetelunas, Corey
I guess we'll we'll go with that.
1:11:28.330 --> 1:11:28.770
Spetelunas, Corey
We'll pause.
1:11:28.780 --> 1:11:35.490
Spetelunas, Corey
Hands up again, Paul, you're able to unmute your microphone if you'd like to ask a question or you could type it in the chat.
1:11:45.40 --> 1:11:45.300
Spetelunas, Corey
Baby.
1:11:47.780 --> 1:11:50.170
Spetelunas, Corey
Uh, my contact info is on the screen.
1:11:50.180 --> 1:11:56.550
Spetelunas, Corey
If you want to call or email, I'd be more than happy to discuss any of these.
1:11:56.640 --> 1:12:4.630
Spetelunas, Corey
Further, I know the Appalachian segment is is particularly I'm a high point on land off radar.
1:12:5.290 --> 1:12:9.390
Spetelunas, Corey
So I I don't mind discussing that further, I'd be happy to do that.
1:12:9.400 --> 1:12:12.250
Spetelunas, Corey
We can get some other, uh.
1:12:12.400 --> 1:12:12.930
Spetelunas, Corey
Interested.
1:12:12.940 --> 1:12:16.920
Spetelunas, Corey
Relevant parties involved to to come to the proper decision there.
1:12:17.920 --> 1:12:22.310
Spetelunas, Corey
Umm so just wanna make sure we're not you.
1:12:22.320 --> 1:12:32.290
Spetelunas, Corey
You don't leave this thinking that the departments you know wasted our time and and pulled the wool over eyes get deal because we we do want your input.
1:12:32.300 --> 1:12:34.240
Spetelunas, Corey
I apologize for how late this is in the process.
1:12:36.720 --> 1:12:39.500
Spetelunas, Corey
But I I I do appreciate the input that we've gotten so far.
1:12:40.920 --> 1:12:44.670
Spetelunas, Corey
Umm, all admitted here to type this question but.
1:12:46.210 --> 1:12:46.590
Spetelunas, Corey
Umm.
1:12:47.80 --> 1:12:51.90
Spetelunas, Corey
If if there's any lingering issues or additional questions.
1:12:53.530 --> 1:12:56.880
Spetelunas, Corey
Concerns you thought felt might have gone unresolved.
1:12:59.70 --> 1:13:2.420
Spetelunas, Corey
They're free to get in touch with me and then we can talk through it.
1:13:3.530 --> 1:13:6.500
Spetelunas, Corey
Also, as I mentioned, the presentation will be on the website.
1:13:6.670 --> 1:13:7.910
Spetelunas, Corey
Hopefully tomorrow.
1:13:8.940 --> 1:13:9.470
Spetelunas, Corey
Umm.
1:13:9.480 --> 1:13:14.170
Spetelunas, Corey
If there's other people that weren't able to attend, feel free to share with them.
1:13:15.510 --> 1:13:17.640
Spetelunas, Corey
There is a Shelburne meeting.
1:13:18.240 --> 1:13:28.300
Spetelunas, Corey
Most of this will be very largely the same information next week on Wednesday, trying to pop Wednesday at their town hall.
1:13:30.340 --> 1:13:30.970
Spetelunas, Corey
No, no.
1:13:30.980 --> 1:13:32.810
Spetelunas, Corey
You're mics enabled, Paul.
1:13:32.820 --> 1:13:40.350
Spetelunas, Corey
There's a mic button up near the top right that you might just have to Click to turn your mic mic on if you have one.
1:13:53.250 --> 1:14:0.480
Spetelunas, Corey
So if anyone's interested in that Shelburne meeting, that that is also noted on the website now, you're more than welcome.
1:14:1.110 --> 1:14:8.30
Spetelunas, Corey
Presumably we won't get flooded out and and have to spill into the hallway or outside or something.
1:14:8.40 --> 1:14:13.800
Spetelunas, Corey
Hopefully so be happy to discuss any additional concerns at that point if if that's easier.
1:14:15.560 --> 1:14:20.60
Spetelunas, Corey
I'm trying to get all the thing we're gonna disable.
1:14:20.70 --> 1:14:22.520
Spetelunas, Corey
You again my mic.
1:14:25.310 --> 1:14:32.110
Spetelunas, Corey
All that should give you the ability to turn your mic on using the MIC button on the top of the Microsoft Teams screen.
1:14:32.930 --> 1:14:35.980
Spetelunas, Corey
I can't physically turn your microphone on the North Shore.
1:14:54.180 --> 1:14:57.910
Spetelunas, Corey
So I I don't mind taking out a minute to Paul if you wanna type out your question.
1:14:58.900 --> 1:15:1.670
Spetelunas, Corey
Anyone else's more than welcome to stick around too.
1:15:3.110 --> 1:15:11.450
Spetelunas, Corey
That that's the only information I have for you and follow up with me if you have any additional questions, concerns, comments.
1:15:13.470 --> 1:15:14.150
Spetelunas, Corey
Appreciate it.
1:15:14.240 --> 1:15:14.880
Spetelunas, Corey
Thank you everyone.
1:15:33.250 --> 1:15:33.650
Spetelunas, Corey
Paul left.
1:15:35.710 --> 1:15:35.860
Spetelunas, Corey
Yeah.
1:15:36.760 --> 1:15:37.30
Spetelunas, Corey
Thank you.
1:15:37.40 --> 1:15:37.600
Spetelunas, Corey
Great help, Amanda.
1:15:41.760 --> 1:15:42.540
Zatecka, AmandaJoe
You're very welcome.
1:15:44.640 --> 1:15:45.440
Spetelunas, Corey
Have a good night everyone.
1:15:46.790 --> 1:15:47.220
Zatecka, AmandaJoe
Night.